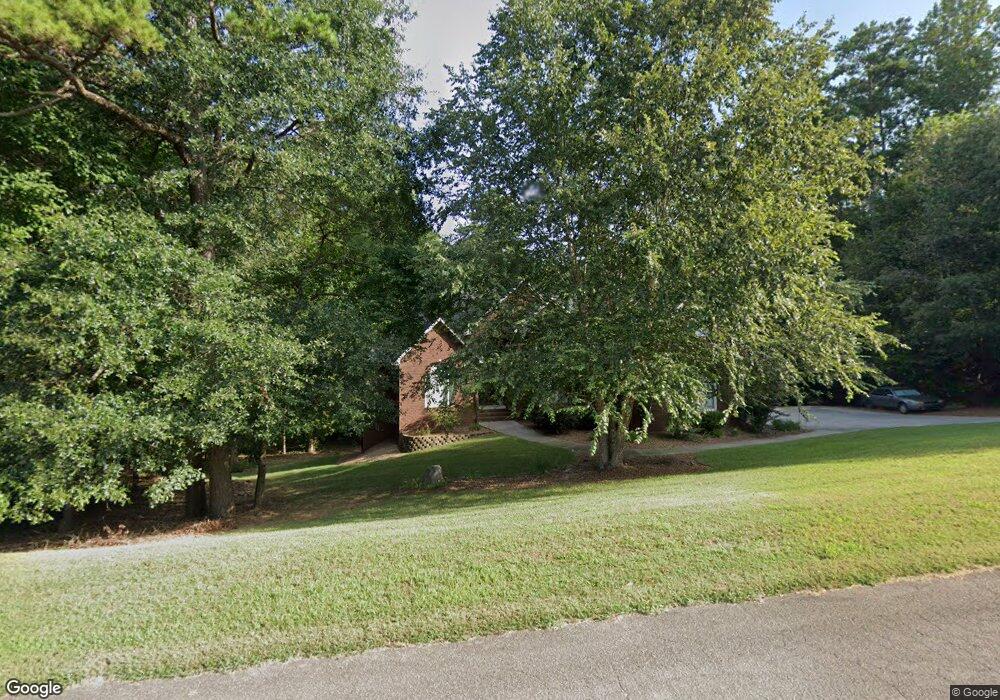
2809 Allendale Ct Concord, NC 28025
Estimated Value: $512,000 - $615,000
3
Beds
3
Baths
2,183
Sq Ft
$253/Sq Ft
Est. Value
About This Home
This home is located at 2809 Allendale Ct, Concord, NC 28025 and is currently estimated at $552,471, approximately $253 per square foot. 2809 Allendale Ct is a home located in Cabarrus County with nearby schools including A.T. Allen Elementary School, Mount Pleasant Middle School, and Mount Pleasant High School.
Ownership History
Date
Name
Owned For
Owner Type
Purchase Details
Closed on
Oct 11, 2006
Sold by
Taylor Steve B and Taylor Rhonda A
Bought by
Lominac Ashley Carl and Lominac Kathyran Annette
Current Estimated Value
Home Financials for this Owner
Home Financials are based on the most recent Mortgage that was taken out on this home.
Original Mortgage
$244,000
Outstanding Balance
$144,793
Interest Rate
6.36%
Mortgage Type
Purchase Money Mortgage
Estimated Equity
$407,678
Purchase Details
Closed on
Jan 31, 2002
Sold by
Shue Gary Dale and Shue Melissa N
Bought by
Taylor Steve B and Bohannon Rhonda A
Home Financials for this Owner
Home Financials are based on the most recent Mortgage that was taken out on this home.
Original Mortgage
$205,200
Interest Rate
7.14%
Mortgage Type
Purchase Money Mortgage
Create a Home Valuation Report for This Property
The Home Valuation Report is an in-depth analysis detailing your home's value as well as a comparison with similar homes in the area
Home Values in the Area
Average Home Value in this Area
Purchase History
| Date | Buyer | Sale Price | Title Company |
|---|---|---|---|
| Lominac Ashley Carl | $305,000 | None Available | |
| Taylor Steve B | $256,500 | -- |
Source: Public Records
Mortgage History
| Date | Status | Borrower | Loan Amount |
|---|---|---|---|
| Open | Lominac Ashley Carl | $244,000 | |
| Previous Owner | Taylor Steve B | $205,200 | |
| Closed | Taylor Steve B | $51,300 |
Source: Public Records
Tax History Compared to Growth
Tax History
| Year | Tax Paid | Tax Assessment Tax Assessment Total Assessment is a certain percentage of the fair market value that is determined by local assessors to be the total taxable value of land and additions on the property. | Land | Improvement |
|---|---|---|---|---|
| 2025 | $3,726 | $543,080 | $91,800 | $451,280 |
| 2024 | $3,611 | $526,420 | $91,800 | $434,620 |
| 2023 | $3,224 | $379,350 | $67,500 | $311,850 |
| 2022 | $3,118 | $375,680 | $67,500 | $308,180 |
| 2021 | $3,062 | $375,680 | $67,500 | $308,180 |
| 2020 | $3,062 | $375,680 | $67,500 | $308,180 |
| 2019 | $2,720 | $333,750 | $47,700 | $286,050 |
| 2018 | $2,653 | $333,750 | $47,700 | $286,050 |
| 2017 | $2,520 | $333,750 | $47,700 | $286,050 |
| 2016 | $2,520 | $289,450 | $40,500 | $248,950 |
| 2015 | $2,156 | $289,450 | $40,500 | $248,950 |
| 2014 | $2,156 | $289,450 | $40,500 | $248,950 |
Source: Public Records
Map
Nearby Homes
- 2817 Allendale Ct
- 2369 Baxter Place SE
- 2365 Baxter Place SE
- 2314 Fairport Dr SE
- 2911 Buffalo Hills Dr
- 2625 Old Airport Rd
- 1695 Lemming Dr
- 1121 Setter Ln SE
- 153 Cottontail Ln SE Unit 46
- 1106 Setter Ln SE
- 1146 Crestmont Dr SE
- 1665 Red Bird Cir
- 1076 Tangle Ridge Dr SE
- 51 Plott Dr SW
- 6175 U S 601
- 3350 Miami Church Rd
- 2406 Everton Cir SE
- 1508 Thompson Dr
- 1128 Tangle Ridge Dr SE
- 0 Hwy 601 Hwy Unit 3073112
- 2805 Allendale Ct
- 2801 Allendale Ct
- 2814 Allendale Ct
- 2802 Allendale Ct
- 2633 Heglar Rd
- 2888 Highway 49 N
- 2821 Allendale Ct
- 2837 Heglar Rd
- 2800 N Carolina 49
- 2825 Allendale Ct
- 2774 Heglar Rd
- 2845 Heglar Rd
- 2849 Heglar Rd
- 2861 Heglar Rd
- 2829 Allendale Ct
- 2850 Heglar Rd
- 2750 Heglar Rd
- 2785 Highway 49 N
- 2781 Highway 49 N
- lot 1B Huntley Ridge