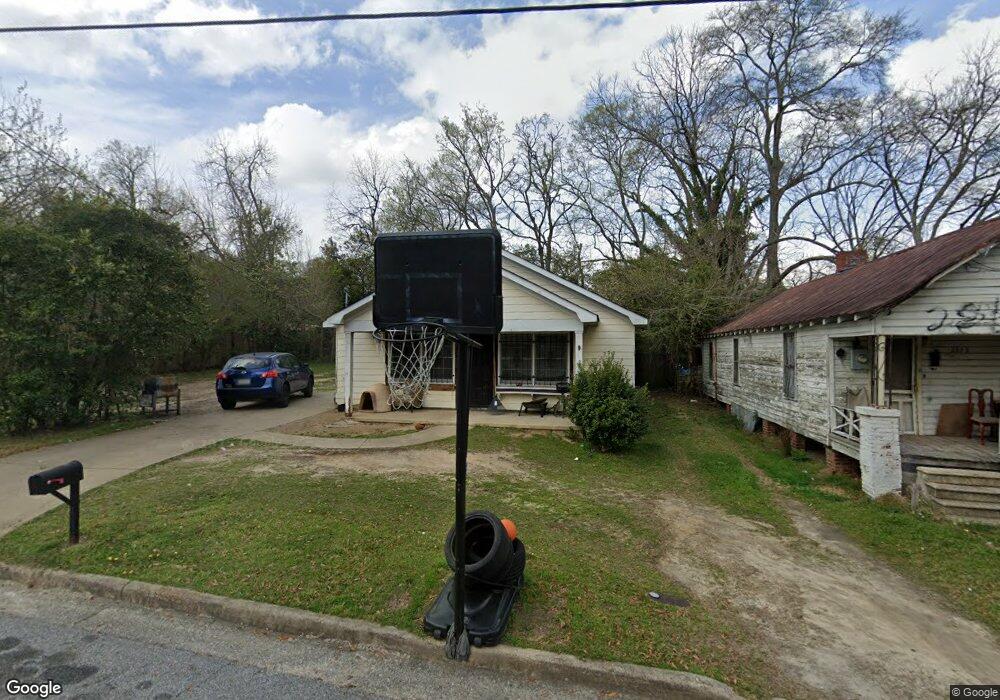
2809 Baldwin St Columbus, GA 31906
East Wynnton-Wynnton Hill NeighborhoodEstimated Value: $94,000 - $134,000
3
Beds
2
Baths
1,260
Sq Ft
$96/Sq Ft
Est. Value
About This Home
This home is located at 2809 Baldwin St, Columbus, GA 31906 and is currently estimated at $120,913, approximately $95 per square foot. 2809 Baldwin St is a home located in Muscogee County with nearby schools including Dorothy Height Elementary School, Rothschild Leadership Academy, and Carver High School.
Ownership History
Date
Name
Owned For
Owner Type
Purchase Details
Closed on
Jul 31, 2017
Sold by
Secretary Of Hsng & Urban Dev Wa Dc
Bought by
Rypur Properties
Current Estimated Value
Purchase Details
Closed on
Nov 8, 2016
Bought by
Sec Of Housing & Urban
Purchase Details
Closed on
Sep 6, 2016
Sold by
Lillian L
Bought by
Wells Fargo Bank
Purchase Details
Closed on
Nov 30, 2010
Sold by
Chi Asset Management Llc
Bought by
Watson Lillian L
Home Financials for this Owner
Home Financials are based on the most recent Mortgage that was taken out on this home.
Original Mortgage
$81,288
Interest Rate
4.25%
Mortgage Type
FHA
Purchase Details
Closed on
Sep 2, 2010
Sold by
Columbus Housing Initiative Inc
Bought by
Chi Asset Management Llc
Home Financials for this Owner
Home Financials are based on the most recent Mortgage that was taken out on this home.
Original Mortgage
$886,382
Interest Rate
4.59%
Mortgage Type
Commercial
Create a Home Valuation Report for This Property
The Home Valuation Report is an in-depth analysis detailing your home's value as well as a comparison with similar homes in the area
Home Values in the Area
Average Home Value in this Area
Purchase History
| Date | Buyer | Sale Price | Title Company |
|---|---|---|---|
| Rypur Properties | $20,900 | -- | |
| Sec Of Housing & Urban | -- | -- | |
| Wells Fargo Bank | $47,600 | -- | |
| Watson Lillian L | $89,500 | None Available | |
| Chi Asset Management Llc | -- | None Available |
Source: Public Records
Mortgage History
| Date | Status | Borrower | Loan Amount |
|---|---|---|---|
| Previous Owner | Watson Lillian L | $81,288 | |
| Previous Owner | Chi Asset Management Llc | $886,382 |
Source: Public Records
Tax History
| Year | Tax Paid | Tax Assessment Tax Assessment Total Assessment is a certain percentage of the fair market value that is determined by local assessors to be the total taxable value of land and additions on the property. | Land | Improvement |
|---|---|---|---|---|
| 2025 | $1,840 | $47,002 | $3,720 | $43,282 |
| 2024 | $1,840 | $52,224 | $3,720 | $48,504 |
| 2023 | $1,193 | $52,224 | $3,720 | $48,504 |
| 2022 | $1,236 | $30,280 | $3,720 | $26,560 |
| 2021 | $980 | $24,000 | $3,720 | $20,280 |
| 2020 | $980 | $24,000 | $3,720 | $20,280 |
| 2019 | $343 | $26,156 | $3,720 | $22,436 |
| 2018 | $343 | $8,360 | $920 | $7,440 |
| 2017 | $1,470 | $35,764 | $3,720 | $32,044 |
| 2016 | $929 | $35,800 | $6,080 | $29,720 |
| 2015 | $931 | $35,800 | $6,080 | $29,720 |
| 2014 | $933 | $35,800 | $6,080 | $29,720 |
| 2013 | -- | $35,800 | $6,080 | $29,720 |
Source: Public Records
Map
Nearby Homes
Your Personal Tour Guide
Ask me questions while you tour the home.