Estimated Value: $315,000 - $341,000
3
Beds
2
Baths
1,609
Sq Ft
$201/Sq Ft
Est. Value
About This Home
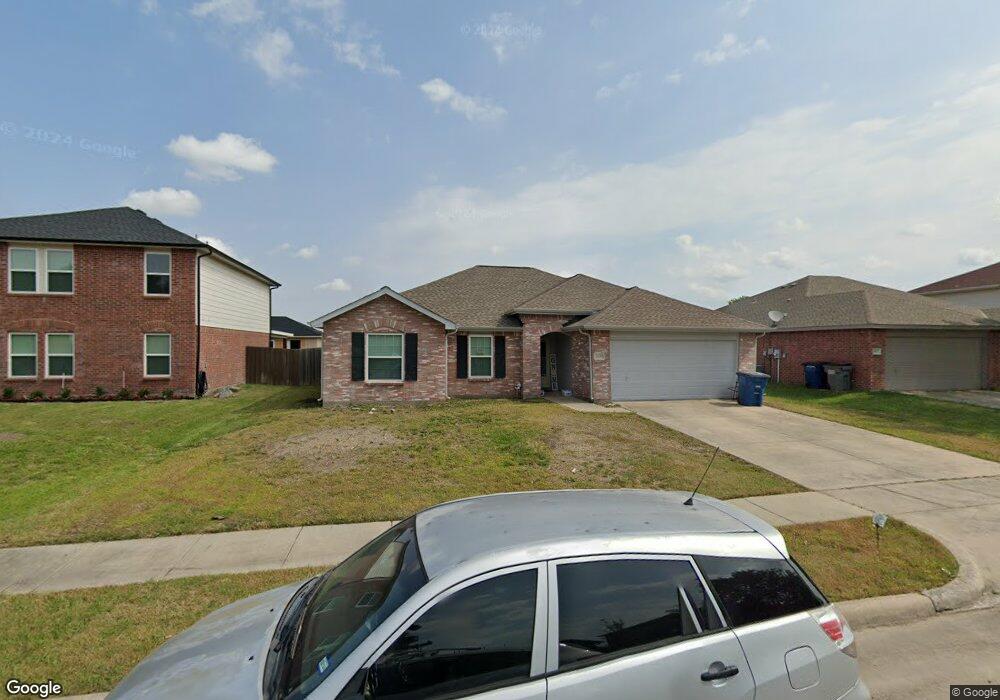
This home is located at 2809 Bissell Way, Wylie, TX 75098 and is currently estimated at $324,078, approximately $201 per square foot. 2809 Bissell Way is a home located in Collin County with nearby schools including P M Akin Elementary School, AB Harrison Intermediate School, and Grady Burnett J High School.
Ownership History
Date
Name
Owned For
Owner Type
Purchase Details
Closed on
Jan 17, 2025
Sold by
Bruce Robert V and Bruce Debra
Bought by
Davis Destiny Michelle
Current Estimated Value
Purchase Details
Closed on
Oct 5, 2007
Sold by
Hud
Bought by
Bruce Robert Verne
Home Financials for this Owner
Home Financials are based on the most recent Mortgage that was taken out on this home.
Original Mortgage
$115,000
Interest Rate
6.55%
Mortgage Type
Purchase Money Mortgage
Purchase Details
Closed on
Oct 6, 2006
Sold by
Wells Fargo Bank Na
Bought by
Hud
Purchase Details
Closed on
Oct 3, 2006
Sold by
Fannin Creslond
Bought by
Wells Fargo Bank Na
Purchase Details
Closed on
Nov 8, 2002
Sold by
Centex Homes
Bought by
Fannin Creslond
Home Financials for this Owner
Home Financials are based on the most recent Mortgage that was taken out on this home.
Original Mortgage
$106,842
Interest Rate
5.95%
Mortgage Type
FHA
Create a Home Valuation Report for This Property
The Home Valuation Report is an in-depth analysis detailing your home's value as well as a comparison with similar homes in the area
Home Values in the Area
Average Home Value in this Area
Purchase History
| Date | Buyer | Sale Price | Title Company |
|---|---|---|---|
| Davis Destiny Michelle | -- | None Listed On Document | |
| Bruce Robert Verne | -- | None Available | |
| Hud | -- | None Available | |
| Wells Fargo Bank Na | $126,003 | None Available | |
| Fannin Creslond | -- | -- |
Source: Public Records
Mortgage History
| Date | Status | Borrower | Loan Amount |
|---|---|---|---|
| Previous Owner | Bruce Robert Verne | $115,000 | |
| Previous Owner | Fannin Creslond | $106,842 |
Source: Public Records
Tax History Compared to Growth
Tax History
| Year | Tax Paid | Tax Assessment Tax Assessment Total Assessment is a certain percentage of the fair market value that is determined by local assessors to be the total taxable value of land and additions on the property. | Land | Improvement |
|---|---|---|---|---|
| 2025 | -- | $321,320 | $90,000 | $240,793 |
| 2024 | -- | $292,109 | $90,000 | $241,011 |
| 2023 | $5,263 | $265,554 | $95,000 | $213,115 |
| 2022 | $5,296 | $241,413 | $75,000 | $198,748 |
| 2021 | $5,164 | $219,466 | $55,000 | $164,466 |
| 2020 | $5,243 | $211,148 | $55,000 | $156,148 |
| 2019 | $5,318 | $202,381 | $55,000 | $152,064 |
| 2018 | $4,955 | $183,983 | $50,000 | $153,592 |
| 2017 | $4,504 | $177,878 | $45,000 | $132,878 |
| 2016 | $4,225 | $158,048 | $35,000 | $123,048 |
| 2015 | -- | $148,139 | $35,000 | $113,139 |
Source: Public Records
Map
Nearby Homes
- 2800 Gold Hill Dr
- 2801-3 N State Highway 78
- 2801-1 N State Highway 78
- 1312 Wyndham Dr
- 209 Duck Blind Ave
- 1308 London Dr
- 2601 Waverly Dr
- 2603 Waverly Dr
- 211 Rutherford Ave
- 2605 Waverly Dr
- 2607 Waverly Dr
- 2606 Waverly Dr
- 2608 Waverly Dr
- 2601 Ackley Ln
- 2603 Ackley Ln
- Santa Fe Plan at Kreymer at the Park
- Omaha Plan at Kreymer at the Park
- Glasgow Plan at Kreymer at the Park
- Mykonos Plan at Kreymer at the Park
- Malmo Plan at Kreymer at the Park
- 2807 Bissell Way
- 2811 Bissell Way
- 2805 Bissell Way
- 2813 Bissell Way
- 2806 Bissell Way
- 2803 Bissell Way
- 2815 Bissell Way
- 2808 Bissell Way
- 2804 Bissell Way
- 2810 Bissell Way
- 2802 Bissell Way
- 2801 Bissell Way
- 2817 Bissell Way
- 2812 Bissell Way
- 2800 Bissell Way
- 2717 Bissell Way
- 2814 Bissell Way
- 2807 Deerborn St
- 2809 Deerborn St
- 2805 Deerborn St