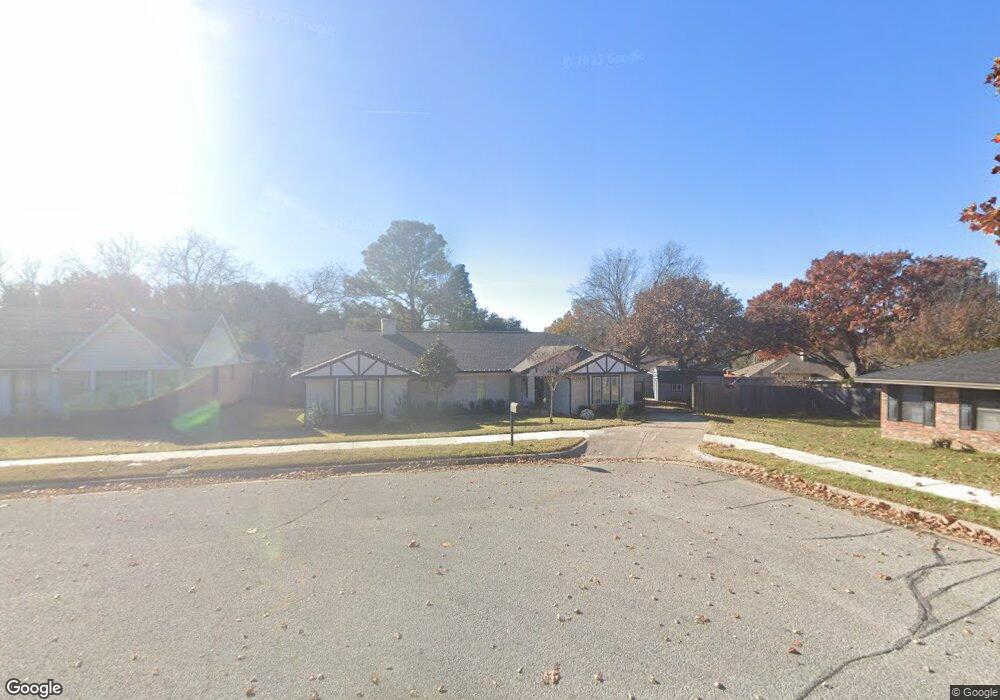
2809 Downing Ct Bedford, TX 76021
Estimated Value: $419,000 - $456,000
4
Beds
3
Baths
2,264
Sq Ft
$197/Sq Ft
Est. Value
About This Home
This home is located at 2809 Downing Ct, Bedford, TX 76021 and is currently estimated at $445,413, approximately $196 per square foot. 2809 Downing Ct is a home located in Tarrant County with nearby schools including Shady Brook Elementary School, Harwood Junior High School, and Trinity High School.
Ownership History
Date
Name
Owned For
Owner Type
Purchase Details
Closed on
Aug 15, 2019
Sold by
Kent Mark
Bought by
Miller Melanie Johnson and Miller Randall K
Current Estimated Value
Home Financials for this Owner
Home Financials are based on the most recent Mortgage that was taken out on this home.
Original Mortgage
$260,200
Outstanding Balance
$226,675
Interest Rate
3.55%
Mortgage Type
FHA
Estimated Equity
$218,738
Purchase Details
Closed on
May 16, 2014
Sold by
Kent Natalena S
Bought by
Kent Natalena S and The Natalena S Kent Living Trust
Purchase Details
Closed on
Apr 4, 2006
Sold by
Kent Natalena Shelton and Kent Natalena S
Bought by
Kent Natalena Shelton and Natalena S Kent Revocable Trust
Purchase Details
Closed on
Mar 6, 2001
Sold by
Kent Lawrence Adams and Kent Natalena S
Bought by
Kent Lawrence A and Kent Natalena S
Create a Home Valuation Report for This Property
The Home Valuation Report is an in-depth analysis detailing your home's value as well as a comparison with similar homes in the area
Home Values in the Area
Average Home Value in this Area
Purchase History
| Date | Buyer | Sale Price | Title Company |
|---|---|---|---|
| Miller Melanie Johnson | -- | Texas Secure Title Company | |
| Kent Natalena S | -- | None Available | |
| Kent Natalena Shelton | -- | None Available | |
| Kent Lawrence A | -- | -- |
Source: Public Records
Mortgage History
| Date | Status | Borrower | Loan Amount |
|---|---|---|---|
| Open | Miller Melanie Johnson | $260,200 |
Source: Public Records
Tax History Compared to Growth
Tax History
| Year | Tax Paid | Tax Assessment Tax Assessment Total Assessment is a certain percentage of the fair market value that is determined by local assessors to be the total taxable value of land and additions on the property. | Land | Improvement |
|---|---|---|---|---|
| 2025 | $4,376 | $424,966 | $75,000 | $349,966 |
| 2024 | $4,376 | $424,966 | $75,000 | $349,966 |
| 2023 | $4,325 | $363,453 | $75,000 | $288,453 |
| 2022 | $6,404 | $293,226 | $75,000 | $218,226 |
| 2021 | $7,924 | $338,561 | $75,000 | $263,561 |
| 2020 | $6,839 | $287,643 | $75,000 | $212,643 |
| 2019 | $6,762 | $278,352 | $75,000 | $203,352 |
| 2018 | $6,624 | $272,648 | $75,000 | $197,648 |
| 2017 | $5,250 | $217,000 | $25,000 | $192,000 |
| 2016 | $4,605 | $190,351 | $25,000 | $165,351 |
| 2015 | $1,897 | $168,929 | $25,000 | $143,929 |
| 2014 | $1,897 | $164,400 | $25,000 | $139,400 |
Source: Public Records
Map
Nearby Homes
- 22 Lincolnshire Cir
- 2112 Oakmeadow Place
- 1723 Post Oak Dr
- 2109 Oakmeadow St
- 1630 Post Oak Dr
- 37 Devonshire Dr
- 2024 Oakmeadow St
- 1601 Warwickshire Ct W
- 1704 Indian Oaks Ct
- 2901 Miles Way
- 1636 Bedford Oaks Dr
- 2524 Shady Ridge Dr
- 2503 Shady Ridge Dr
- 2220 Tiffany Glenn Ct
- 2909 Oakridge Dr
- 1401 Danielle Dr
- 3532 Meadowside Dr
- 2417 Meadow Ct
- 31 Morrow Dr
- 3513 Meadowside Dr
- 2813 Downing Ct
- 2805 Downing Ct
- 1913 Lincolnshire Dr
- 1909 Lincolnshire Dr
- 1905 Lincolnshire Dr
- 1917 Lincolnshire Dr
- 6 Lincolnshire Cir
- 2817 Downing Ct
- 2 Lincolnshire Cir
- 10 Lincolnshire Cir
- 2821 Downing Ct
- 14 Lincolnshire Cir
- 2216 Ridgewood
- 2212 Ridgewood
- 2220 Ridgewood
- 2208 Ridgewood
- 1916 Lincolnshire Dr
- 1912 Lincolnshire Dr
- 2224 Ridgewood
- 1920 Lincolnshire Dr