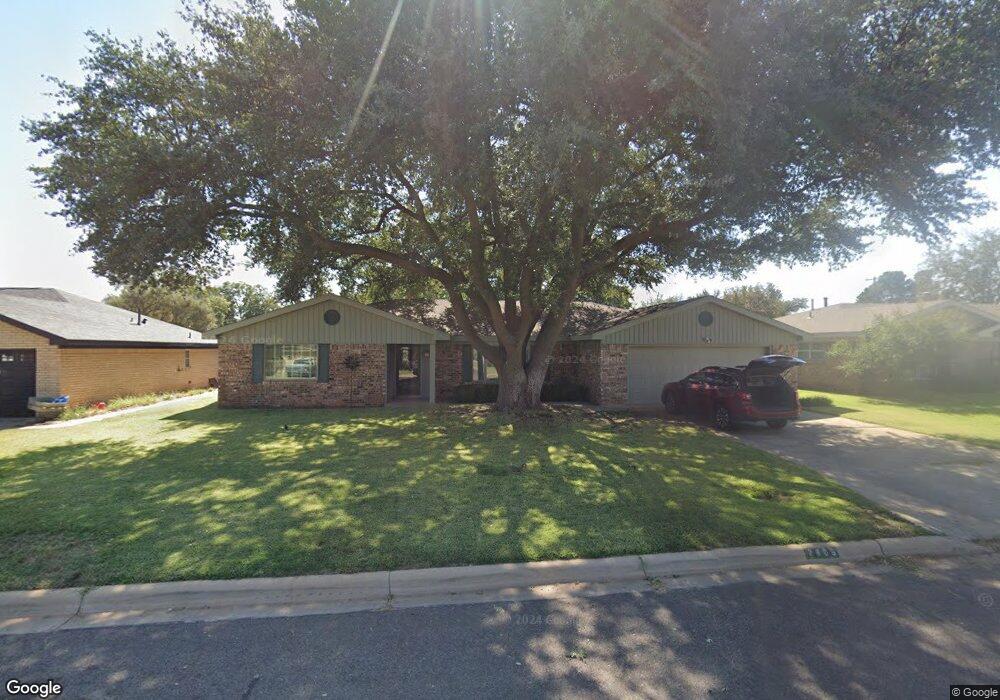
2809 Durant Dr Midland, TX 79705
Estimated Value: $396,000 - $424,000
--
Bed
2
Baths
2,610
Sq Ft
$158/Sq Ft
Est. Value
About This Home
This home is located at 2809 Durant Dr, Midland, TX 79705 and is currently estimated at $413,495, approximately $158 per square foot. 2809 Durant Dr is a home located in Midland County with nearby schools including Midland High School, Robert H. Goddard Junior High School, and Midland Christian School.
Ownership History
Date
Name
Owned For
Owner Type
Purchase Details
Closed on
Jan 27, 2006
Sold by
Olliff Donovan and Oliff Andree J
Bought by
Sanchez Francisco M
Current Estimated Value
Purchase Details
Closed on
Jan 24, 2005
Sold by
Stevenson John and Stevenson Debra D
Bought by
Nims Robert C and Nims Kathleen
Purchase Details
Closed on
Sep 29, 2004
Sold by
Kenan Tracie E
Bought by
Nims Robert C
Purchase Details
Closed on
Mar 19, 2004
Sold by
Kenan Tracie E
Bought by
Nims Robert C
Purchase Details
Closed on
Mar 15, 2004
Sold by
Phillips Dillard J
Bought by
Nims Robert C
Purchase Details
Closed on
Jan 1, 1987
Bought by
Nims Robert C
Purchase Details
Closed on
Sep 1, 1972
Bought by
Nims Robert C
Purchase Details
Closed on
Oct 1, 1971
Bought by
Nims Robert C
Create a Home Valuation Report for This Property
The Home Valuation Report is an in-depth analysis detailing your home's value as well as a comparison with similar homes in the area
Home Values in the Area
Average Home Value in this Area
Purchase History
| Date | Buyer | Sale Price | Title Company |
|---|---|---|---|
| Sanchez Francisco M | -- | Lone Star Abstract & Title C | |
| Nims Robert C | -- | None Available | |
| Nims Robert C | -- | -- | |
| Nims Robert C | -- | -- | |
| Nims Robert C | -- | -- | |
| Nims Robert C | -- | -- | |
| Nims Robert C | -- | -- | |
| Nims Robert C | -- | -- |
Source: Public Records
Tax History Compared to Growth
Tax History
| Year | Tax Paid | Tax Assessment Tax Assessment Total Assessment is a certain percentage of the fair market value that is determined by local assessors to be the total taxable value of land and additions on the property. | Land | Improvement |
|---|---|---|---|---|
| 2025 | $2,891 | $362,380 | $27,220 | $335,160 |
| 2024 | $2,898 | $375,010 | $27,220 | $347,790 |
| 2023 | $5,474 | $365,280 | $27,220 | $338,060 |
| 2022 | $5,579 | $357,110 | $27,220 | $329,890 |
| 2021 | $5,988 | $343,730 | $27,220 | $316,510 |
| 2020 | $4,550 | $343,550 | $27,220 | $316,330 |
| 2019 | $6,251 | $330,180 | $27,220 | $316,330 |
| 2018 | $5,836 | $300,160 | $27,220 | $272,940 |
| 2017 | $5,491 | $282,420 | $27,220 | $255,200 |
| 2016 | $5,219 | $275,930 | $27,220 | $248,710 |
| 2015 | -- | $275,930 | $27,220 | $248,710 |
| 2014 | -- | $270,540 | $27,220 | $243,320 |
Source: Public Records
Map
Nearby Homes
- 2811 Durant Dr
- 4 Amhurst Ct
- 2817 Maxwell Dr
- 5 Chatham Ct
- 2605 Inwood Ct
- 63 Ironwood Ct Unit 91
- 63 Ironwood Ct
- 3 Marinor Ct
- 3200 Durant Dr
- 3200 W Wadley Ave
- 3203 Maxwell Dr
- 3205 Maxwell Dr
- 3204 W Wadley Ave
- 3207 Marmon Dr
- 3200 Whitney Dr
- 2806 Auburn Dr
- 2505 Maxwell Dr
- 3105 Auburn Dr
- 2800 Cimmaron Ave
- 2400 Metz Ct