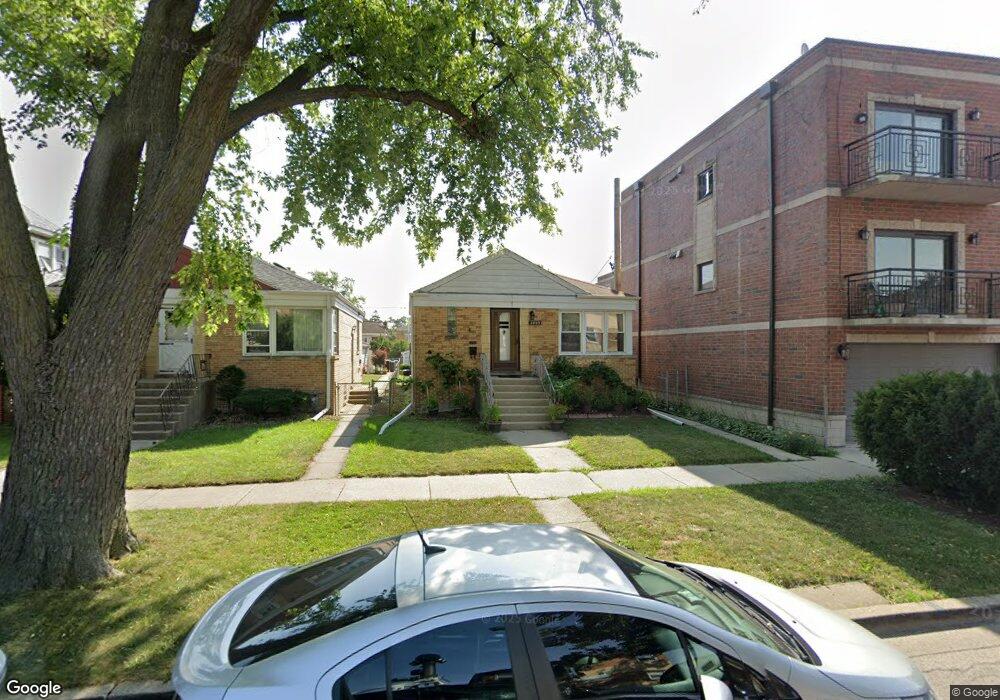
2809 N 75th Ct Elmwood Park, IL 60707
Estimated Value: $286,000 - $327,000
2
Beds
1
Bath
809
Sq Ft
$388/Sq Ft
Est. Value
About This Home
This home is located at 2809 N 75th Ct, Elmwood Park, IL 60707 and is currently estimated at $313,861, approximately $387 per square foot. 2809 N 75th Ct is a home located in Cook County with nearby schools including John Mills Elementary School, Elm Middle School, and Elmwood Park High School.
Ownership History
Date
Name
Owned For
Owner Type
Purchase Details
Closed on
May 11, 2016
Sold by
Bode Lulezim F and Bode Diana
Bought by
Bode Lulezim F
Current Estimated Value
Purchase Details
Closed on
Feb 14, 2005
Sold by
Bode Lulezim F
Bought by
Bode Lulezim F and Bode Diana
Purchase Details
Closed on
Sep 10, 2004
Sold by
Mazur Maria
Bought by
Bode Lulezim F
Home Financials for this Owner
Home Financials are based on the most recent Mortgage that was taken out on this home.
Original Mortgage
$212,500
Outstanding Balance
$105,629
Interest Rate
5.93%
Mortgage Type
Unknown
Estimated Equity
$208,232
Purchase Details
Closed on
Nov 21, 1997
Sold by
Celler Daniel S and Celler Donald S
Bought by
Mitera Krzysztof and Mazur Maria
Home Financials for this Owner
Home Financials are based on the most recent Mortgage that was taken out on this home.
Original Mortgage
$123,000
Interest Rate
7.46%
Purchase Details
Closed on
Nov 18, 1993
Sold by
Pioneer Bank & Trust Company
Bought by
Celler Donald S and Celler Patricia A
Create a Home Valuation Report for This Property
The Home Valuation Report is an in-depth analysis detailing your home's value as well as a comparison with similar homes in the area
Home Values in the Area
Average Home Value in this Area
Purchase History
| Date | Buyer | Sale Price | Title Company |
|---|---|---|---|
| Bode Lulezim F | -- | None Available | |
| Bode Lulezim F | -- | -- | |
| Bode Lulezim F | $250,000 | Pntn | |
| Mitera Krzysztof | $139,500 | -- | |
| Celler Donald S | $86,000 | -- |
Source: Public Records
Mortgage History
| Date | Status | Borrower | Loan Amount |
|---|---|---|---|
| Open | Bode Lulezim F | $212,500 | |
| Previous Owner | Mitera Krzysztof | $123,000 |
Source: Public Records
Tax History Compared to Growth
Tax History
| Year | Tax Paid | Tax Assessment Tax Assessment Total Assessment is a certain percentage of the fair market value that is determined by local assessors to be the total taxable value of land and additions on the property. | Land | Improvement |
|---|---|---|---|---|
| 2024 | $6,562 | $25,000 | $5,569 | $19,431 |
| 2023 | $6,337 | $25,000 | $5,569 | $19,431 |
| 2022 | $6,337 | $25,000 | $5,569 | $19,431 |
| 2021 | $6,273 | $20,030 | $3,712 | $16,318 |
| 2020 | $6,143 | $20,030 | $3,712 | $16,318 |
| 2019 | $5,541 | $22,431 | $3,712 | $18,719 |
| 2018 | $5,167 | $19,348 | $3,196 | $16,152 |
| 2017 | $5,397 | $20,568 | $3,196 | $17,372 |
| 2016 | $5,116 | $20,568 | $3,196 | $17,372 |
| 2015 | $4,679 | $17,682 | $2,887 | $14,795 |
| 2014 | $4,575 | $17,682 | $2,887 | $14,795 |
| 2013 | $4,445 | $17,682 | $2,887 | $14,795 |
Source: Public Records
Map
Nearby Homes
- 2832 N 75th Ave
- 2908 N 75th Ct
- 2734 N 74th Ct
- 2730 N 74th Ct Unit GW
- 2719 N 74th Ct
- 2709 N 76th Ct
- 2915 N 74th Ave Unit 2
- 3009 N Oriole Ave Unit 103
- 3013 N Oriole Ave
- 2711 N 77th Ave
- 7722 W Sunset Dr
- 39 W Conti Pkwy Unit 1S
- 2724 N 73rd Ave
- 2716 N 73rd Ave
- 2922 N 77th Ct
- 2637 N 73rd Ct
- 7816 W Sunset Dr
- 2734 N 72nd Ct
- 3030 N 77th Ave
- 2521 N 76th Ave Unit 2SW
- 2811 N 75th Ct
- 2815 N 75th Ct
- 7514 W Diversey Ave Unit 3SE
- 7514 W Diversey Ave Unit 2NE
- 7514 W Diversey Ave Unit 3NE
- 7514 W Diversey Ave Unit 2SE
- 7514 W Diversey Ave Unit 3N
- 7514 W Diversey Ave Unit 3S
- 7514 W Diversey Ave Unit 1CE
- 2807 N 75th Ct Unit 2C
- 2807 N 75th Ct Unit 3C
- 7520 W Diversey Ave Unit 1A
- 2805 N 75th Ct Unit 1B
- 2805 N 75th Ct Unit 3B
- 2805 N 75th Ct Unit 2A
- 2805 N 75th Ct Unit 2B
- 2805 N 75th Ct Unit 3A
- 7516 W Diversey Ave Unit 2SW
- 7516 W Diversey Ave Unit 3SW
- 7516 W Diversey Ave Unit 2NW