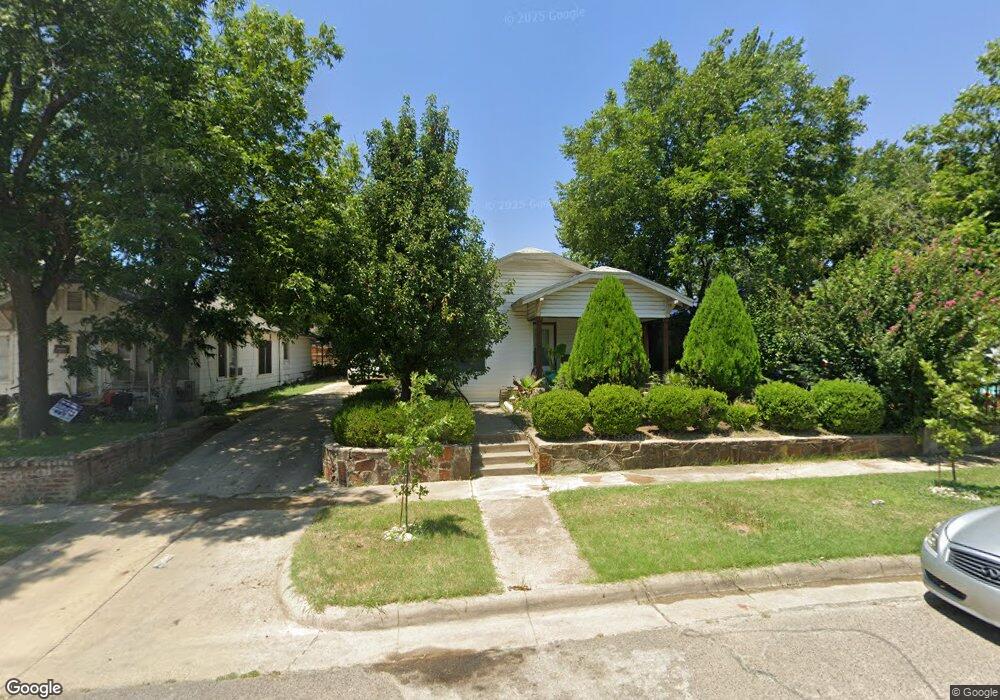
2809 Rosen Ave Fort Worth, TX 76106
Northside NeighborhoodEstimated Value: $162,000 - $222,000
3
Beds
1
Bath
728
Sq Ft
$253/Sq Ft
Est. Value
About This Home
This home is located at 2809 Rosen Ave, Fort Worth, TX 76106 and is currently estimated at $183,917, approximately $252 per square foot. 2809 Rosen Ave is a home located in Tarrant County with nearby schools including Kirkpatrick Elementary School, Kirkpatrick Middle School, and North Side High School.
Ownership History
Date
Name
Owned For
Owner Type
Purchase Details
Closed on
Jun 21, 2023
Sold by
Ibarra Antonio and Ibarra Maria E
Bought by
Serrano Jose Jesus Ibarra
Current Estimated Value
Purchase Details
Closed on
Feb 13, 2007
Sold by
Estrada Antonio and Estrada Monica
Bought by
Ibarra Antonio and Ibarra Maria
Home Financials for this Owner
Home Financials are based on the most recent Mortgage that was taken out on this home.
Original Mortgage
$36,000
Interest Rate
6.21%
Mortgage Type
Purchase Money Mortgage
Purchase Details
Closed on
Jul 30, 2004
Sold by
Rosen Heights Baptist Church
Bought by
Estrada Antonio and Estrada Monica
Home Financials for this Owner
Home Financials are based on the most recent Mortgage that was taken out on this home.
Original Mortgage
$28,800
Interest Rate
6.3%
Mortgage Type
Purchase Money Mortgage
Purchase Details
Closed on
May 5, 2004
Sold by
Ozment Laura
Bought by
Rosen Heights Baptist Church
Create a Home Valuation Report for This Property
The Home Valuation Report is an in-depth analysis detailing your home's value as well as a comparison with similar homes in the area
Home Values in the Area
Average Home Value in this Area
Purchase History
| Date | Buyer | Sale Price | Title Company |
|---|---|---|---|
| Serrano Jose Jesus Ibarra | -- | None Listed On Document | |
| Ibarra Antonio | -- | Will Rogers Texas Title | |
| Estrada Antonio | -- | Metroplex Title Inc | |
| Rosen Heights Baptist Church | -- | -- |
Source: Public Records
Mortgage History
| Date | Status | Borrower | Loan Amount |
|---|---|---|---|
| Previous Owner | Ibarra Antonio | $36,000 | |
| Previous Owner | Estrada Antonio | $28,800 |
Source: Public Records
Tax History Compared to Growth
Tax History
| Year | Tax Paid | Tax Assessment Tax Assessment Total Assessment is a certain percentage of the fair market value that is determined by local assessors to be the total taxable value of land and additions on the property. | Land | Improvement |
|---|---|---|---|---|
| 2025 | $3,429 | $152,802 | $49,000 | $103,802 |
| 2024 | $3,429 | $152,802 | $49,000 | $103,802 |
| 2023 | $3,162 | $139,729 | $35,000 | $104,729 |
| 2022 | $2,374 | $91,317 | $13,000 | $78,317 |
| 2021 | $2,297 | $83,730 | $13,000 | $70,730 |
| 2020 | $2,070 | $78,195 | $13,000 | $65,195 |
| 2019 | $2,309 | $83,942 | $13,000 | $70,942 |
| 2018 | $1,594 | $57,934 | $13,000 | $44,934 |
| 2017 | $1,559 | $55,035 | $13,000 | $42,035 |
| 2016 | $1,475 | $52,065 | $13,000 | $39,065 |
| 2015 | $1,039 | $36,600 | $13,220 | $23,380 |
| 2014 | $1,039 | $36,600 | $13,220 | $23,380 |
Source: Public Records
Map
Nearby Homes
- 2517 NW 29th St
- Lot 3B Lake Prarie Trail
- 2922 Columbus Ave
- 2919 Columbus Ave
- 2610 Columbus Ave
- 2717 NW 27th St
- 3009 Columbus Ave
- 2913 Pearl Ave
- 2961 Pearl Ave
- 2911 Market Ave
- 2719 NW 25th St
- 2707 NW 24th St
- 2921 Market Ave
- 2705 NW 34th St
- 2929 Angle Ave
- 2316 Roosevelt Ave
- 2927 Angle Ave
- 2958 Columbus Ave
- 2500 NW 20th St
- 2713 NW 35th St
- 2807 Rosen Ave
- 2811 Rosen Ave
- 2805 Rosen Ave
- 2813 Rosen Ave
- 2803 Rosen Ave
- 2810 Hanna Ave
- 2812 Hanna Ave
- 2814 Hanna Ave
- 2804 Hanna Ave
- 2808 Rosen Ave
- 2901 Rosen Ave
- 2806 Rosen Ave
- 2810 Rosen Ave
- 2801 Rosen Ave
- 2804 Rosen Ave
- 2812 Rosen Ave
- 2802 Rosen Ave
- 2900 Hanna Ave
- 1812 NW 28th St
- 2900 Rosen Ave