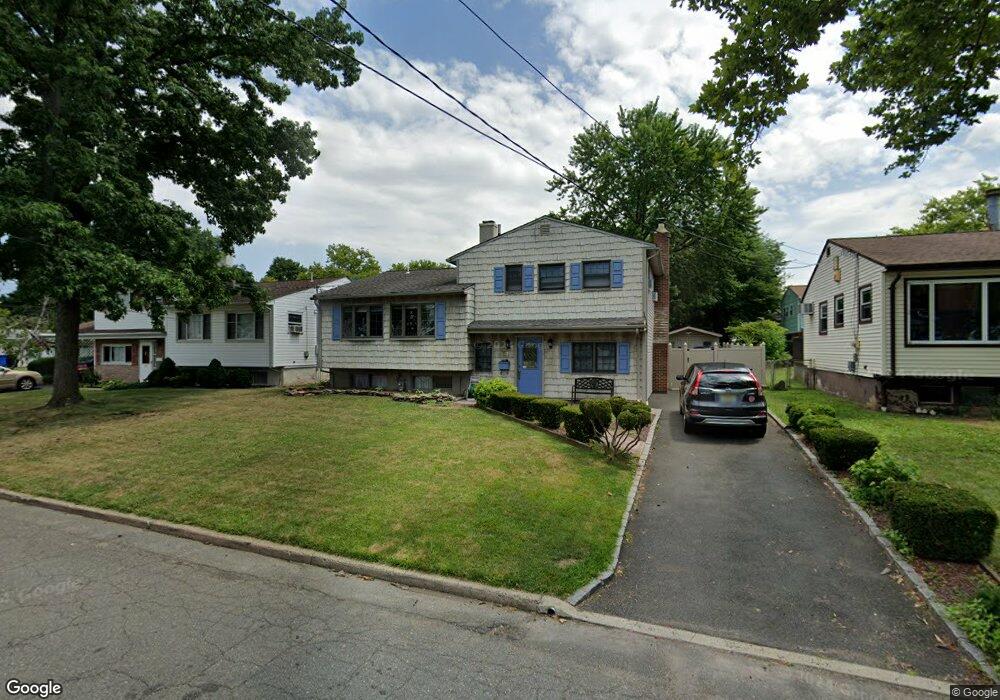
281 Cypress Dr Colonia, NJ 07067
Estimated Value: $447,880 - $652,000
4
Beds
2
Baths
1,586
Sq Ft
$373/Sq Ft
Est. Value
About This Home
This home is located at 281 Cypress Dr, Colonia, NJ 07067 and is currently estimated at $591,970, approximately $373 per square foot. 281 Cypress Dr is a home located in Middlesex County with nearby schools including Oak Ridge Heights Elementary School, Colonia Middle School, and Colonia High School.
Ownership History
Date
Name
Owned For
Owner Type
Purchase Details
Closed on
Nov 15, 2013
Sold by
Colonna Vincent J and Colonna Claire M
Bought by
Behun Anthony and Behun Kathleen
Current Estimated Value
Home Financials for this Owner
Home Financials are based on the most recent Mortgage that was taken out on this home.
Original Mortgage
$331,987
Interest Rate
4.24%
Mortgage Type
VA
Create a Home Valuation Report for This Property
The Home Valuation Report is an in-depth analysis detailing your home's value as well as a comparison with similar homes in the area
Home Values in the Area
Average Home Value in this Area
Purchase History
| Date | Buyer | Sale Price | Title Company |
|---|---|---|---|
| Behun Anthony | $325,000 | Prestige Title Agency Inc |
Source: Public Records
Mortgage History
| Date | Status | Borrower | Loan Amount |
|---|---|---|---|
| Previous Owner | Behun Anthony | $331,987 |
Source: Public Records
Tax History Compared to Growth
Tax History
| Year | Tax Paid | Tax Assessment Tax Assessment Total Assessment is a certain percentage of the fair market value that is determined by local assessors to be the total taxable value of land and additions on the property. | Land | Improvement |
|---|---|---|---|---|
| 2025 | $9,474 | $78,300 | $22,000 | $56,300 |
| 2024 | $9,269 | $78,300 | $22,000 | $56,300 |
| 2023 | $9,269 | $78,300 | $22,000 | $56,300 |
| 2022 | $9,039 | $78,300 | $22,000 | $56,300 |
| 2021 | $8,965 | $78,300 | $22,000 | $56,300 |
| 2020 | $8,694 | $78,300 | $22,000 | $56,300 |
| 2019 | $8,489 | $78,300 | $22,000 | $56,300 |
| 2018 | $8,327 | $78,300 | $22,000 | $56,300 |
| 2017 | $8,181 | $78,300 | $22,000 | $56,300 |
| 2016 | $8,117 | $78,300 | $22,000 | $56,300 |
| 2015 | $7,975 | $78,300 | $22,000 | $56,300 |
| 2014 | $7,804 | $78,300 | $22,000 | $56,300 |
Source: Public Records
Map
Nearby Homes
- 37 E Hegel Ave
- 86 Normandy Rd
- 14 Bonnie Ln
- 67 Brookside Terrace
- 131 Morningside Rd
- 41 Clover Ave
- 52 Brookside Terrace
- 11 Bernice St
- 24 Woodland Rd
- 868 Inman Ave
- 99 Cameo Place
- 70 Lancaster Rd
- 54 Morningside Rd
- 984 Feather Bed Ln
- 74 Westminster Rd
- 91 Amherst Ave
- 80 Gaywood Ave
- 12 W Clark Place
- 23 Westminster Rd
- 24 Sandalwood Dr
- 277 Cypress Dr
- 285 Cypress Dr
- 83 Starlight Dr
- 80 Califon Dr
- 76 Califon Dr
- 79 Starlight Dr
- 274 Cypress Dr
- 280 Cypress Dr
- 265 Cypress Dr
- 297 Cypress Dr
- 262 Cypress Dr
- 72 Califon Dr
- 75 Starlight Dr
- 79 Califon Dr
- 78 Starlight Dr
- 286 Cypress Dr
- 301 Cypress Dr
- 11 E Sherman Ave
- 256 Cypress Dr
- 261 Cypress Dr