281 Daniels St Pontotoc, MI 38863
Estimated Value: $122,358 - $200,000
4
Beds
1
Bath
1,523
Sq Ft
$103/Sq Ft
Est. Value
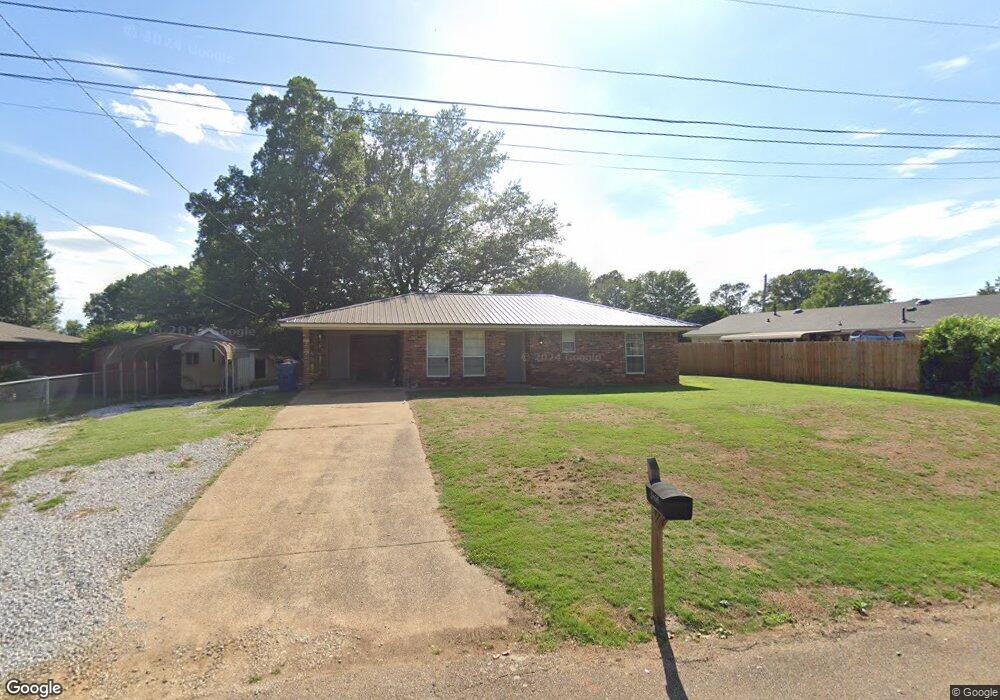
About This Home
This home is located at 281 Daniels St, Pontotoc, MI 38863 and is currently estimated at $157,340, approximately $103 per square foot. 281 Daniels St is a home located in Pontotoc County with nearby schools including Pontotoc Elementary School, D.T. Cox Elementary School, and Pontotoc Middle School.
Ownership History
Date
Name
Owned For
Owner Type
Purchase Details
Closed on
Nov 22, 2019
Sold by
Smith Yvonne B
Bought by
Smith Wesley Benjamin
Current Estimated Value
Home Financials for this Owner
Home Financials are based on the most recent Mortgage that was taken out on this home.
Original Mortgage
$66,783
Interest Rate
3.5%
Mortgage Type
Unknown
Purchase Details
Closed on
Sep 26, 2019
Sold by
Benjamin Charles R
Bought by
Smith Yvonne B
Home Financials for this Owner
Home Financials are based on the most recent Mortgage that was taken out on this home.
Original Mortgage
$66,783
Interest Rate
3.5%
Mortgage Type
Unknown
Create a Home Valuation Report for This Property
The Home Valuation Report is an in-depth analysis detailing your home's value as well as a comparison with similar homes in the area
Home Values in the Area
Average Home Value in this Area
Purchase History
| Date | Buyer | Sale Price | Title Company |
|---|---|---|---|
| Smith Wesley Benjamin | -- | None Available | |
| Smith Yvonne B | -- | None Available |
Source: Public Records
Mortgage History
| Date | Status | Borrower | Loan Amount |
|---|---|---|---|
| Previous Owner | Smith Yvonne B | $66,783 |
Source: Public Records
Tax History Compared to Growth
Tax History
| Year | Tax Paid | Tax Assessment Tax Assessment Total Assessment is a certain percentage of the fair market value that is determined by local assessors to be the total taxable value of land and additions on the property. | Land | Improvement |
|---|---|---|---|---|
| 2024 | $913 | $7,147 | $0 | $0 |
| 2023 | $912 | $7,147 | $0 | $0 |
| 2022 | $567 | $6,503 | $0 | $0 |
| 2021 | $588 | $6,503 | $0 | $0 |
| 2020 | $787 | $6,345 | $0 | $0 |
| 2019 | $1,190 | $9,425 | $0 | $0 |
| 2018 | $1,123 | $8,891 | $0 | $0 |
| 2017 | $0 | $8,891 | $0 | $0 |
| 2016 | $0 | $5,967 | $0 | $0 |
| 2015 | -- | $6,037 | $0 | $0 |
| 2014 | -- | $6,037 | $0 | $0 |
Source: Public Records
Map
Nearby Homes