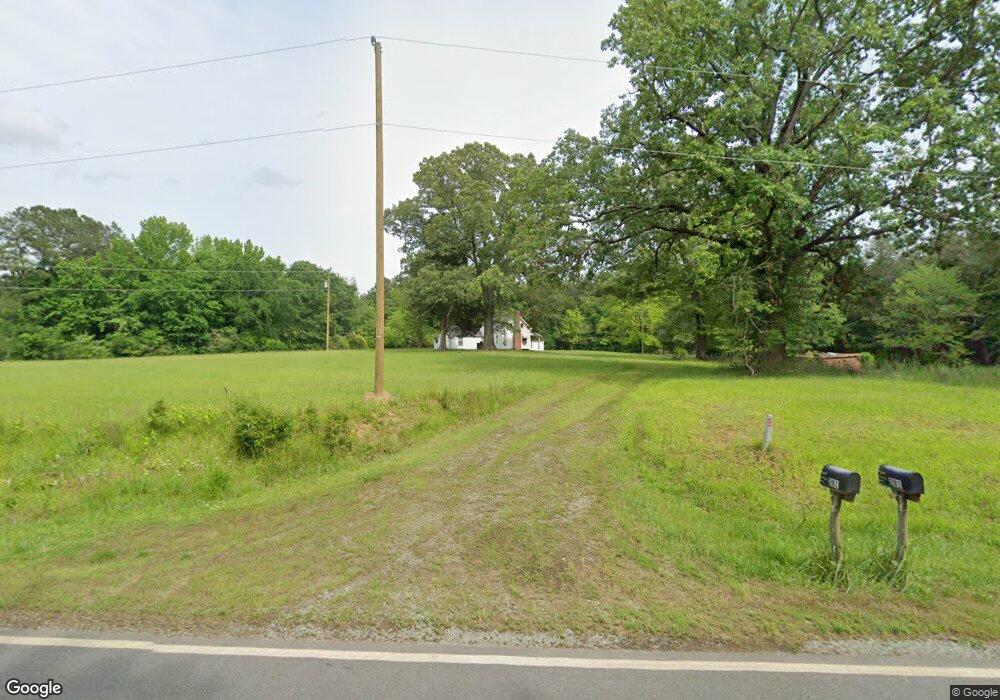
281 Dee Farrell Rd Pittsboro, NC 27312
Estimated Value: $309,876 - $528,000
2
Beds
1
Bath
978
Sq Ft
$405/Sq Ft
Est. Value
About This Home
This home is located at 281 Dee Farrell Rd, Pittsboro, NC 27312 and is currently estimated at $395,625, approximately $404 per square foot. 281 Dee Farrell Rd is a home located in Chatham County with nearby schools including Pittsboro Elementary School, George Moses Horton Middle School, and Thales Academy Pittsboro Pre-K-6.
Ownership History
Date
Name
Owned For
Owner Type
Purchase Details
Closed on
Aug 21, 2020
Sold by
Farrell Larry Joseph and Farrell Josette Hipps
Bought by
Farrell Joey and Farrell Josette
Current Estimated Value
Purchase Details
Closed on
Aug 28, 2002
Sold by
Farrell Sr Larry J
Bought by
Farrell Larry Joseph and Farrell Josette Hipps
Create a Home Valuation Report for This Property
The Home Valuation Report is an in-depth analysis detailing your home's value as well as a comparison with similar homes in the area
Home Values in the Area
Average Home Value in this Area
Purchase History
| Date | Buyer | Sale Price | Title Company |
|---|---|---|---|
| Farrell Joey | -- | None Available | |
| Farrell Larry Joseph | -- | -- |
Source: Public Records
Tax History Compared to Growth
Tax History
| Year | Tax Paid | Tax Assessment Tax Assessment Total Assessment is a certain percentage of the fair market value that is determined by local assessors to be the total taxable value of land and additions on the property. | Land | Improvement |
|---|---|---|---|---|
| 2025 | $1,749 | $224,262 | $151,244 | $73,018 |
| 2024 | $1,749 | $158,692 | $112,092 | $46,600 |
| 2023 | $1,313 | $158,692 | $112,092 | $46,600 |
| 2022 | $1,256 | $158,692 | $112,092 | $46,600 |
| 2021 | $1,258 | $158,692 | $112,092 | $46,600 |
| 2020 | $1,258 | $167,635 | $113,164 | $54,471 |
| 2019 | $1,454 | $167,635 | $113,164 | $54,471 |
| 2018 | $1,383 | $167,635 | $113,164 | $54,471 |
| 2017 | $1,383 | $167,635 | $113,164 | $54,471 |
| 2016 | $1,113 | $130,575 | $88,410 | $42,165 |
| 2015 | $1,097 | $130,575 | $88,410 | $42,165 |
| 2014 | $1,088 | $130,575 | $88,410 | $42,165 |
| 2013 | -- | $130,575 | $88,410 | $42,165 |
Source: Public Records
Map
Nearby Homes
- 245 Hanks Loop Rd
- 59 Riverstone Dr
- 102 Peddler Mill Way Unit 23
- 115 Evington Dr Unit 29
- 226 Evington Dr
- 186 Evington Dr
- 240 Riverstone Dr
- 291 Riverstone Dr
- 82 Stevens Creek Dr
- 0 Us 64 E Unit 10094521
- 639 Hills of the Haw Rd
- 211 Hills of the Haw
- 345 Parkland Dr
- 333 Parkland Dr
- 313 Parkland Dr
- 32 Relaxing Way
- 285 Parkland Dr
- 339 Parkland Dr
- 18 Relaxing Way
- 68 Rainfall Dr
- 383 Dee Farrell Rd
- 217 Dee Farrell Rd
- 509 Fearrington Post
- 0 Dee Farrell Rd Unit TR1830880
- 363 Dee Farrell Rd
- 376 Dee Farrell Rd
- 0 Arborgate Rd Unit 1870642
- 0 Arborgate Rd Unit 941015
- 0 Arborgate Rd Unit 972866
- 0 Arborgate Rd Unit 3 TR1870642
- 139 Dee Farrell Rd
- 563 Foxfire Trace
- 602 Dee Farrell Rd
- 1421 Hanks Chapel Rd
- 7285 U S Highway 64 E
- 417 Foxfire Trace
- 309 Arborgate
- 763 Foxfire Trace
- 1419 Hanks Chapel Rd
- 73 Dee Farrell Rd