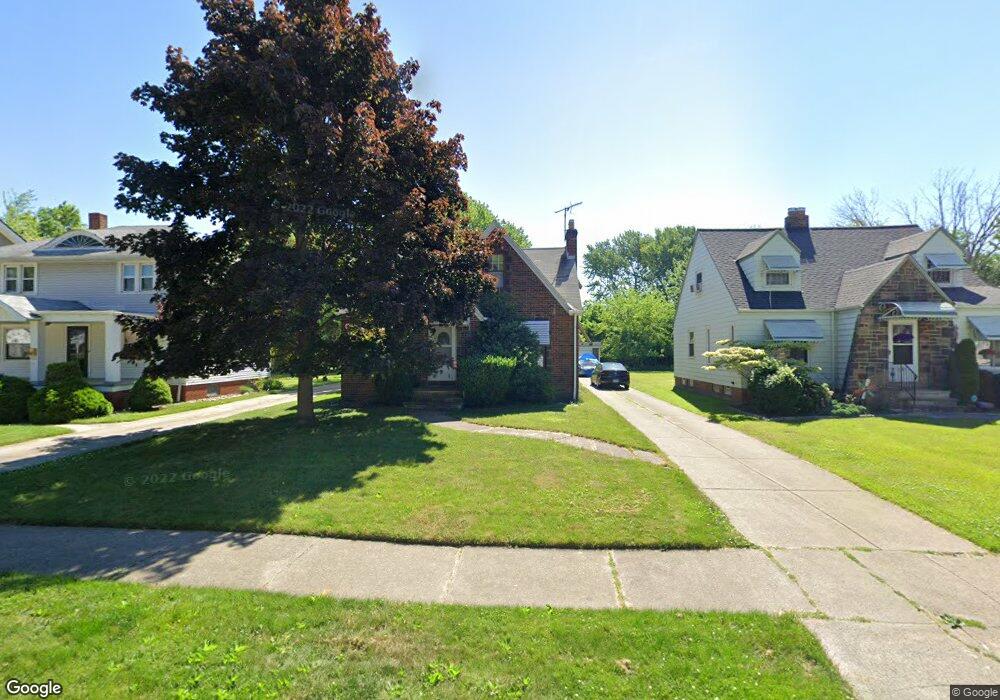
281 E 218th St Euclid, OH 44123
Estimated Value: $147,935 - $173,000
3
Beds
1
Bath
1,380
Sq Ft
$117/Sq Ft
Est. Value
About This Home
This home is located at 281 E 218th St, Euclid, OH 44123 and is currently estimated at $161,484, approximately $117 per square foot. 281 E 218th St is a home located in Cuyahoga County with nearby schools including Arbor Elementary School, Euclid Middle School, and Euclid High School.
Ownership History
Date
Name
Owned For
Owner Type
Purchase Details
Closed on
Feb 27, 2007
Sold by
Zielinski Scott G and Zielinski Lisa A
Bought by
Williams Sharon
Current Estimated Value
Home Financials for this Owner
Home Financials are based on the most recent Mortgage that was taken out on this home.
Original Mortgage
$94,900
Interest Rate
6.18%
Mortgage Type
Purchase Money Mortgage
Purchase Details
Closed on
Apr 28, 1993
Sold by
Zukowski Mary Ann
Bought by
Zielinski Scott G
Purchase Details
Closed on
Apr 14, 1993
Sold by
Lenard Julia
Bought by
Zukowski Mary Ann
Purchase Details
Closed on
Jul 15, 1987
Sold by
Julia Lenard
Bought by
Lenard Julia
Purchase Details
Closed on
Mar 31, 1981
Sold by
Lenard Anthony
Bought by
Julia Lenard
Purchase Details
Closed on
Sep 27, 1979
Sold by
Lenard Anthony and Lenard Julia
Bought by
Lenard Anthony
Purchase Details
Closed on
Jan 1, 1975
Bought by
Lenard Anthony and Lenard Julia
Create a Home Valuation Report for This Property
The Home Valuation Report is an in-depth analysis detailing your home's value as well as a comparison with similar homes in the area
Home Values in the Area
Average Home Value in this Area
Purchase History
| Date | Buyer | Sale Price | Title Company |
|---|---|---|---|
| Williams Sharon | $99,900 | Provident | |
| Zielinski Scott G | $75,000 | -- | |
| Zukowski Mary Ann | -- | -- | |
| Lenard Julia | -- | -- | |
| Julia Lenard | -- | -- | |
| Lenard Anthony | -- | -- | |
| Lenard Anthony | -- | -- |
Source: Public Records
Mortgage History
| Date | Status | Borrower | Loan Amount |
|---|---|---|---|
| Previous Owner | Williams Sharon | $94,900 |
Source: Public Records
Tax History
| Year | Tax Paid | Tax Assessment Tax Assessment Total Assessment is a certain percentage of the fair market value that is determined by local assessors to be the total taxable value of land and additions on the property. | Land | Improvement |
|---|---|---|---|---|
| 2025 | $3,416 | $51,450 | $11,830 | $39,620 |
| 2024 | $3,525 | $51,450 | $11,830 | $39,620 |
| 2023 | $3,028 | $35,080 | $8,510 | $26,570 |
| 2022 | $2,959 | $35,070 | $8,510 | $26,570 |
| 2021 | $3,300 | $35,070 | $8,510 | $26,570 |
| 2020 | $3,348 | $32,480 | $7,880 | $24,610 |
| 2019 | $3,012 | $92,800 | $22,500 | $70,300 |
| 2018 | $2,959 | $32,480 | $7,880 | $24,610 |
| 2017 | $3,122 | $27,830 | $6,580 | $21,250 |
| 2016 | $3,128 | $27,830 | $6,580 | $21,250 |
| 2015 | $2,847 | $27,830 | $6,580 | $21,250 |
| 2014 | $2,847 | $27,830 | $6,580 | $21,250 |
Source: Public Records
Map
Nearby Homes
- 336 E 222nd St
- 226 E 216th St
- 285 E 216th St
- 170 E 220th St
- 461 Kenwood Dr Unit T3
- 421 Kenwood Dr Unit G
- 450 Kenwood Dr Unit D-12
- 324 E 215th St
- 422 Clearview Dr Unit J10
- 94 E 217th St
- 22751 Fox Ave
- 521 Kenwood Dr Unit B-5
- 442 Clearview Dr Unit U9
- 115 E 211th St
- 144 E 208th St
- 273 E 208th St
- 21971 Crystal Ave
- 21051 S Lake Shore Blvd
- 21670 Crystal Ave
- 55 Sunnycliff Dr
Your Personal Tour Guide
Ask me questions while you tour the home.