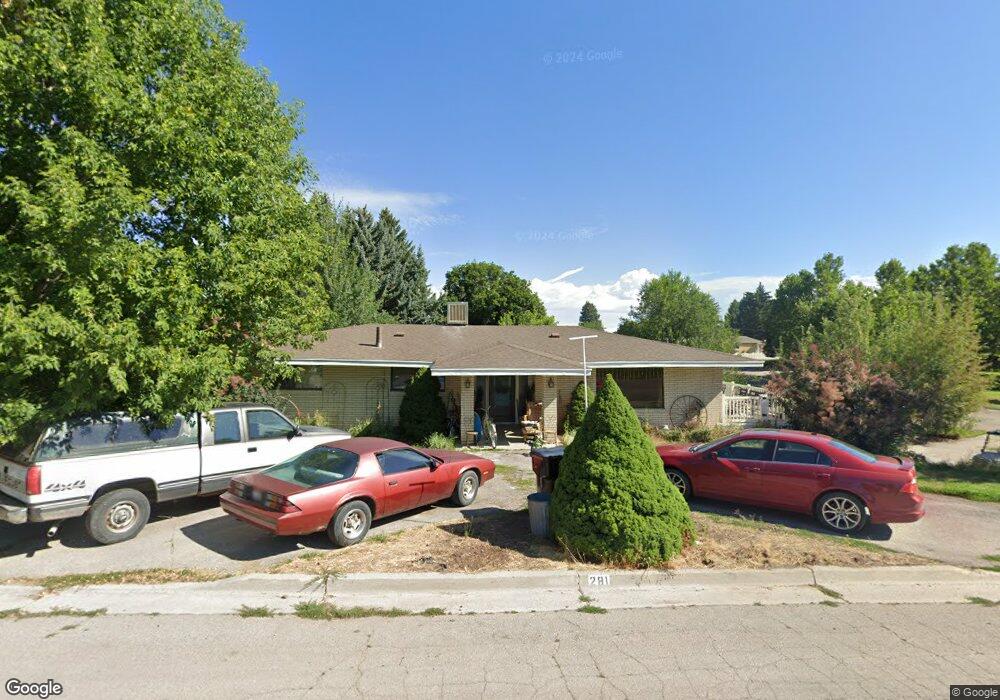
281 E 2nd S Preston, ID 83263
Estimated Value: $419,000 - $484,000
5
Beds
4
Baths
2,934
Sq Ft
$153/Sq Ft
Est. Value
About This Home
This home is located at 281 E 2nd S, Preston, ID 83263 and is currently estimated at $448,021, approximately $152 per square foot. 281 E 2nd S is a home located in Franklin County with nearby schools including Pioneer Elementary School, Oakwood Elementary School, and Preston Junior High School.
Ownership History
Date
Name
Owned For
Owner Type
Purchase Details
Closed on
Mar 14, 2023
Sold by
Bingham Blair W
Bought by
Blair And Nichole Bingham Revocable Trust
Current Estimated Value
Purchase Details
Closed on
Jun 14, 2012
Sold by
Bingham Nichole
Bought by
Bingham Blair W
Home Financials for this Owner
Home Financials are based on the most recent Mortgage that was taken out on this home.
Original Mortgage
$137,700
Interest Rate
3.79%
Mortgage Type
New Conventional
Purchase Details
Closed on
Nov 14, 2011
Sold by
Hyde Linda S and Hyde Kyle Jon
Bought by
Bingham Blair W and Bingham Nichole
Home Financials for this Owner
Home Financials are based on the most recent Mortgage that was taken out on this home.
Original Mortgage
$137,600
Interest Rate
3.95%
Mortgage Type
New Conventional
Create a Home Valuation Report for This Property
The Home Valuation Report is an in-depth analysis detailing your home's value as well as a comparison with similar homes in the area
Home Values in the Area
Average Home Value in this Area
Purchase History
| Date | Buyer | Sale Price | Title Company |
|---|---|---|---|
| Blair And Nichole Bingham Revocable Trust | -- | -- | |
| Bingham Blair W | -- | None Available | |
| Bingham Blair W | -- | -- |
Source: Public Records
Mortgage History
| Date | Status | Borrower | Loan Amount |
|---|---|---|---|
| Previous Owner | Bingham Blair W | $137,700 | |
| Previous Owner | Bingham Blair W | $137,600 |
Source: Public Records
Tax History
| Year | Tax Paid | Tax Assessment Tax Assessment Total Assessment is a certain percentage of the fair market value that is determined by local assessors to be the total taxable value of land and additions on the property. | Land | Improvement |
|---|---|---|---|---|
| 2025 | $2,251 | $452,573 | $60,000 | $392,573 |
| 2024 | $2,379 | $452,573 | $60,000 | $392,573 |
| 2023 | $2,197 | $452,573 | $60,000 | $392,573 |
| 2022 | $3,225 | $459,728 | $40,158 | $419,570 |
| 2021 | $2,194 | $317,684 | $40,158 | $277,526 |
| 2019 | $2,006 | $241,869 | $40,158 | $201,711 |
| 2018 | $1,944 | $231,188 | $29,477 | $201,711 |
| 2017 | $1,422 | $191,719 | $29,477 | $162,242 |
| 2016 | $1,370 | $171,527 | $29,477 | $142,050 |
| 2015 | $1,377 | $176,407 | $29,477 | $146,930 |
| 2014 | $28,176 | $176,407 | $29,477 | $146,930 |
| 2013 | $25,213 | $180,160 | $29,480 | $150,680 |
Source: Public Records
Map
Nearby Homes
Your Personal Tour Guide
Ask me questions while you tour the home.