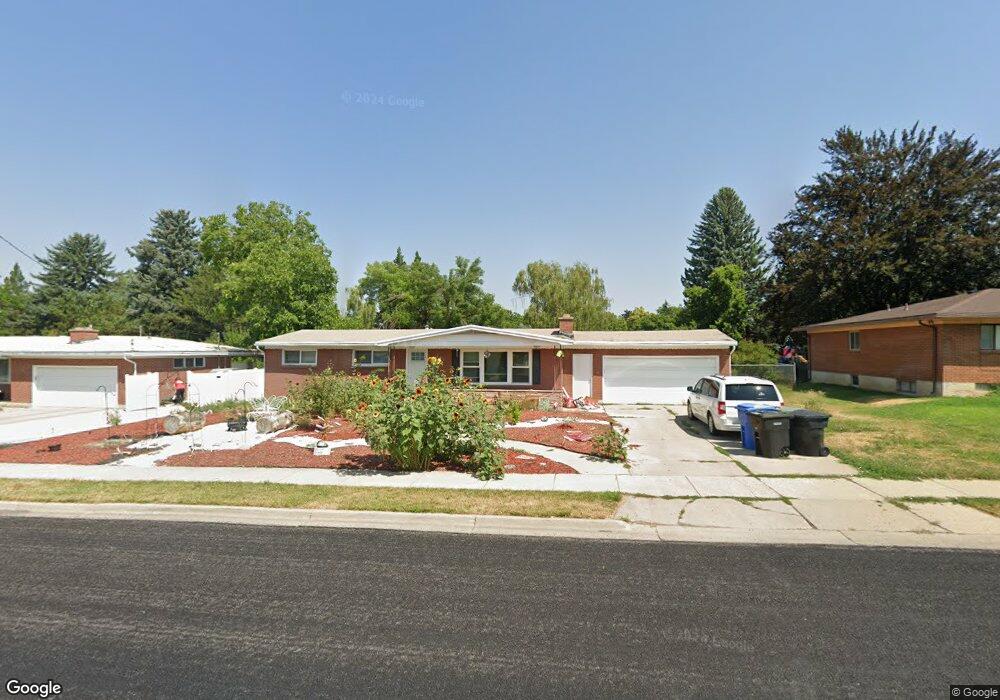
281 E 800 N Logan, UT 84321
Adams NeighborhoodEstimated Value: $432,000 - $511,000
5
Beds
3
Baths
2,680
Sq Ft
$173/Sq Ft
Est. Value
About This Home
This home is located at 281 E 800 N, Logan, UT 84321 and is currently estimated at $462,574, approximately $172 per square foot. 281 E 800 N is a home located in Cache County with nearby schools including Adams Elementary School, Mount Logan Middle School, and Logan High School.
Ownership History
Date
Name
Owned For
Owner Type
Purchase Details
Closed on
Aug 1, 2019
Sold by
Carter Candi S and Olson Timothy P
Bought by
Olson Candi S Carter
Current Estimated Value
Home Financials for this Owner
Home Financials are based on the most recent Mortgage that was taken out on this home.
Original Mortgage
$224,000
Outstanding Balance
$195,741
Interest Rate
3.8%
Mortgage Type
New Conventional
Estimated Equity
$266,833
Purchase Details
Closed on
Jun 6, 2016
Sold by
Olson Candi S Carter
Bought by
Olson Candi S Carter and Olson Timothy P
Home Financials for this Owner
Home Financials are based on the most recent Mortgage that was taken out on this home.
Original Mortgage
$199,500
Interest Rate
3.59%
Mortgage Type
New Conventional
Purchase Details
Closed on
Dec 17, 2010
Sold by
Kunz Kaleb
Bought by
Burtenshaw Brandon and Burtenshaw Amy
Home Financials for this Owner
Home Financials are based on the most recent Mortgage that was taken out on this home.
Original Mortgage
$168,555
Interest Rate
4.75%
Mortgage Type
FHA
Purchase Details
Closed on
Oct 28, 2010
Sold by
Kunz Kaleb and Haguewood Ty
Bought by
Kunz Kaleb
Home Financials for this Owner
Home Financials are based on the most recent Mortgage that was taken out on this home.
Original Mortgage
$168,555
Interest Rate
4.75%
Mortgage Type
FHA
Purchase Details
Closed on
Mar 12, 2010
Sold by
The Secretary Of Housing & Urban Develop
Bought by
Kunz Kaleb and Haguewood Ty
Home Financials for this Owner
Home Financials are based on the most recent Mortgage that was taken out on this home.
Original Mortgage
$154,995
Interest Rate
4.94%
Mortgage Type
Purchase Money Mortgage
Purchase Details
Closed on
Sep 16, 2009
Sold by
Gmac Mortgage Llc
Bought by
The Secretary Of Housing & Urban Develop
Purchase Details
Closed on
Sep 2, 2009
Sold by
Lee Michael A
Bought by
Gmac Mortgage Llc
Purchase Details
Closed on
Mar 27, 2008
Sold by
Bolingbroke Jeffrey and Bolingbroke Emilee
Bought by
Lee Michael A
Home Financials for this Owner
Home Financials are based on the most recent Mortgage that was taken out on this home.
Original Mortgage
$200,998
Interest Rate
5.72%
Mortgage Type
FHA
Purchase Details
Closed on
Mar 26, 2008
Sold by
Lee Michael A
Bought by
Lee Michael A and Lee Kristen
Home Financials for this Owner
Home Financials are based on the most recent Mortgage that was taken out on this home.
Original Mortgage
$200,998
Interest Rate
5.72%
Mortgage Type
FHA
Create a Home Valuation Report for This Property
The Home Valuation Report is an in-depth analysis detailing your home's value as well as a comparison with similar homes in the area
Home Values in the Area
Average Home Value in this Area
Purchase History
| Date | Buyer | Sale Price | Title Company |
|---|---|---|---|
| Olson Candi S Carter | -- | Inwest Title Svcs Inc Logan | |
| Olson Candi S Carter | -- | Pinnacle Title | |
| Olson Candi S Carter | -- | Pinnacle Title | |
| Burtenshaw Brandon | -- | Cache Title Company | |
| Kunz Kaleb | -- | Bonneville Superior Title Co | |
| Kunz Kaleb | -- | American Secure Title | |
| The Secretary Of Housing & Urban Develop | -- | None Available | |
| Gmac Mortgage Llc | $216,304 | None Available | |
| Lee Michael A | -- | American Secure Title | |
| Lee Michael A | -- | Cache Title Company |
Source: Public Records
Mortgage History
| Date | Status | Borrower | Loan Amount |
|---|---|---|---|
| Open | Olson Candi S Carter | $224,000 | |
| Closed | Olson Candi S Carter | $199,500 | |
| Previous Owner | Burtenshaw Brandon | $168,555 | |
| Previous Owner | Kunz Kaleb | $154,995 | |
| Previous Owner | Lee Michael A | $200,998 |
Source: Public Records
Tax History
| Year | Tax Paid | Tax Assessment Tax Assessment Total Assessment is a certain percentage of the fair market value that is determined by local assessors to be the total taxable value of land and additions on the property. | Land | Improvement |
|---|---|---|---|---|
| 2025 | $1,963 | $253,890 | $0 | $0 |
| 2024 | $203 | $253,890 | $0 | $0 |
| 2023 | $2,116 | $252,680 | $0 | $0 |
| 2022 | $2,266 | $252,680 | $0 | $0 |
| 2021 | $177 | $304,830 | $46,000 | $258,830 |
| 2020 | $1,581 | $245,100 | $46,000 | $199,100 |
| 2019 | $1,652 | $245,100 | $46,000 | $199,100 |
| 2018 | $1,694 | $229,456 | $46,000 | $183,456 |
| 2017 | $1,612 | $115,390 | $0 | $0 |
| 2016 | $1,671 | $101,475 | $0 | $0 |
| 2015 | $1,471 | $101,475 | $0 | $0 |
| 2014 | $1,330 | $101,475 | $0 | $0 |
| 2013 | -- | $100,685 | $0 | $0 |
Source: Public Records
Map
Nearby Homes
Your Personal Tour Guide
Ask me questions while you tour the home.