Estimated Value: $81,000 - $125,000
About This Home
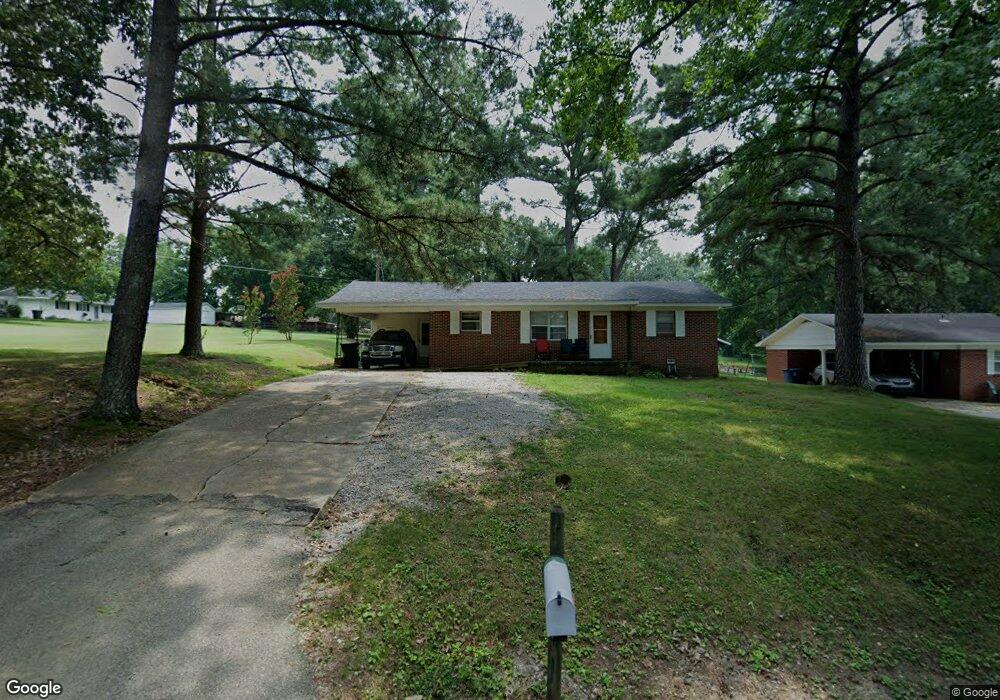
This home is located at 281 E South St, Dyer, TN 38330 and is currently estimated at $94,247, approximately $85 per square foot. 281 E South St is a home located in Gibson County with nearby schools including Dyer Elementary School and Gibson County High School.
Ownership History
We collect this data history from publicly available records. To have your information removed, we recommend requesting removal directly through your county’s website.
Purchase Details
Purchase Details
Purchase Details
Purchase Details
Home Financials for this Owner
Home Financials are based on the most recent Mortgage that was taken out on this home.Purchase Details
Purchase Details
Purchase History
We collect this data history from publicly available records. To have your information removed, we recommend requesting removal directly through your county’s website.
| Date | Buyer | Sale Price | Title Company |
|---|---|---|---|
| $20,150 | -- | ||
| $13,679 | -- | ||
| $45,000 | -- | ||
| $50,000 | -- | ||
| -- | -- | ||
| -- | -- |
Mortgage History
We collect this data history from publicly available records. To have your information removed, we recommend requesting removal directly through your county’s website.
| Date | Status | Borrower | Loan Amount |
|---|---|---|---|
| Previous Owner | $50,000 |
Tax History
We collect this data history from publicly available records. To have your information removed, we recommend requesting removal directly through your county’s website.
| Year | Tax Paid | Tax Assessment Tax Assessment Total Assessment is a certain percentage of the fair market value that is determined by local assessors to be the total taxable value of land and additions on the property. | Land | Improvement |
|---|---|---|---|---|
| 2025 | $738 | $20,425 | $2,500 | $17,925 |
| 2024 | $707 | $20,425 | $2,500 | $17,925 |
| 2023 | $387 | $12,425 | $1,150 | $11,275 |
| 2022 | $378 | $12,425 | $1,150 | $11,275 |
| 2021 | $378 | $12,425 | $1,150 | $11,275 |
| 2020 | $618 | $12,425 | $1,150 | $11,275 |
| 2019 | $617 | $12,425 | $1,150 | $11,275 |
| 2018 | $653 | $12,925 | $1,150 | $11,775 |
| 2017 | $627 | $12,925 | $1,150 | $11,775 |
| 2016 | $627 | $12,925 | $1,150 | $11,775 |
| 2015 | $571 | $12,925 | $1,150 | $11,775 |
| 2014 | $571 | $12,925 | $1,150 | $11,775 |
Map
- 298 High St
- 299 E Walnut St
- 216 S Poplar St
- 372 E Maple St
- 354 E Maple St
- 226 Madison St
- 137 W South St
- 403 E College St
- 205 Division St
- 208 & 210 Lee St
- 148 Scattered Acres Loop
- 76 New Bethlehem Rd
- 43 Watson Rd
- 23 Gravettes Crossing Rd W
- 254 Tennessee 185
- 253 New Hope Rd
- 901 S Trenton St
- 385 Trenton Hwy
- 48 Charlie Morris Rd
- 406 Tennessee 185
Ask me questions while you tour the home.