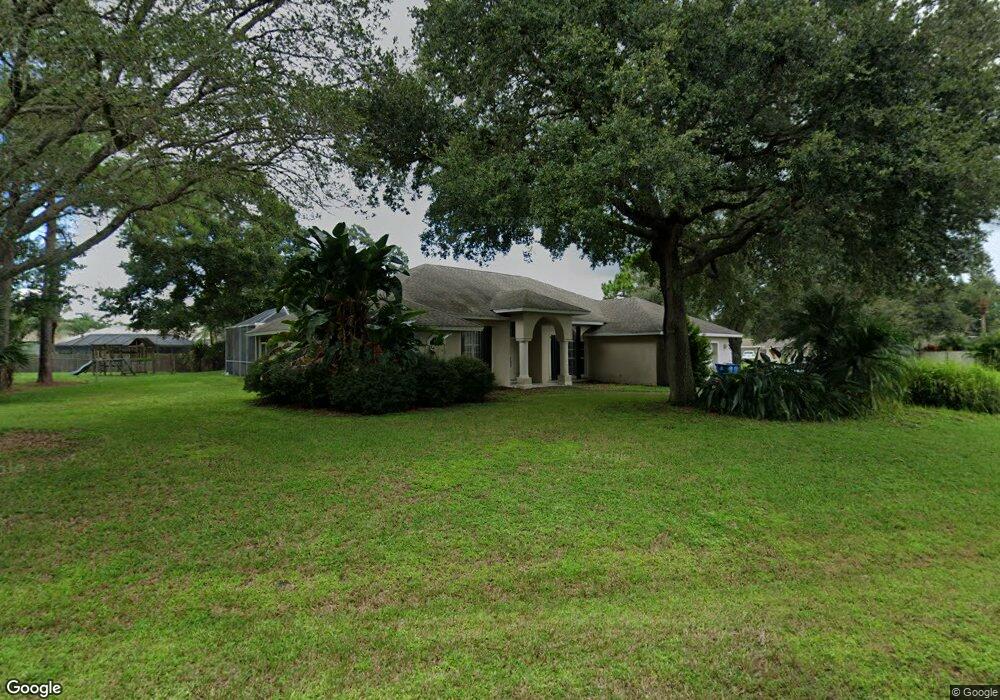
281 Naylor St NE Palm Bay, FL 32907
Estimated Value: $459,000 - $499,000
3
Beds
2
Baths
2,263
Sq Ft
$212/Sq Ft
Est. Value
About This Home
This home is located at 281 Naylor St NE, Palm Bay, FL 32907 and is currently estimated at $479,837, approximately $212 per square foot. 281 Naylor St NE is a home located in Brevard County with nearby schools including Lockmar Elementary School, Central Middle School, and Palm Bay Magnet Senior High School.
Ownership History
Date
Name
Owned For
Owner Type
Purchase Details
Closed on
Jul 29, 2014
Sold by
Mcwilliams Michael E and Mcwilliams Ellen
Bought by
Mcwilliams Ellen
Current Estimated Value
Purchase Details
Closed on
Aug 29, 2013
Sold by
Mcwilliams Michael E and Mcwilliams Ellen
Bought by
Mcwilliams Ellen
Purchase Details
Closed on
Jun 17, 2009
Sold by
Mcwilliams Michael E
Bought by
Mcwilliams Ellen
Purchase Details
Closed on
Dec 31, 2002
Sold by
Sandy Point Land Dev Corp
Bought by
Mcwilliams Michael and Mcwilliams Ellen
Purchase Details
Closed on
Jun 15, 1994
Sold by
Nichols Darrell A and Nichols Ruth A
Bought by
Sandy Pt Land Dev Corp
Home Financials for this Owner
Home Financials are based on the most recent Mortgage that was taken out on this home.
Original Mortgage
$130,000
Interest Rate
8.52%
Create a Home Valuation Report for This Property
The Home Valuation Report is an in-depth analysis detailing your home's value as well as a comparison with similar homes in the area
Home Values in the Area
Average Home Value in this Area
Purchase History
| Date | Buyer | Sale Price | Title Company |
|---|---|---|---|
| Mcwilliams Ellen | -- | None Available | |
| Mcwilliams Ellen | -- | None Available | |
| Mcwilliams Ellen | -- | None Available | |
| Mcwilliams Michael | $35,500 | -- | |
| Sandy Pt Land Dev Corp | $26,000 | -- |
Source: Public Records
Mortgage History
| Date | Status | Borrower | Loan Amount |
|---|---|---|---|
| Previous Owner | Sandy Pt Land Dev Corp | $130,000 |
Source: Public Records
Tax History Compared to Growth
Tax History
| Year | Tax Paid | Tax Assessment Tax Assessment Total Assessment is a certain percentage of the fair market value that is determined by local assessors to be the total taxable value of land and additions on the property. | Land | Improvement |
|---|---|---|---|---|
| 2025 | $2,357 | $170,250 | -- | -- |
| 2024 | $2,297 | $165,460 | -- | -- |
| 2023 | $2,297 | $160,650 | $0 | $0 |
| 2022 | $2,203 | $155,980 | $0 | $0 |
| 2021 | $2,247 | $151,440 | $0 | $0 |
| 2020 | $2,201 | $149,350 | $0 | $0 |
| 2019 | $2,418 | $146,000 | $0 | $0 |
| 2018 | $2,362 | $143,280 | $0 | $0 |
| 2017 | $2,389 | $140,340 | $0 | $0 |
| 2016 | $2,144 | $137,460 | $23,500 | $113,960 |
| 2015 | $2,186 | $136,510 | $20,000 | $116,510 |
| 2014 | $2,196 | $135,430 | $20,000 | $115,430 |
Source: Public Records
Map
Nearby Homes
- 271 Naylor St NE
- 238 Nesbitt St NE
- 824 Emerson Dr NE
- 130 Nesbitt St NE
- 942 Peachland Ave NE Unit 45
- 359 Brescia St NE
- 961 Haas Ave NE
- 588 Audubon Ave NE
- 920 Pellam Ave NE
- 326 Brescia St NE
- 557 Audubon Ave NE
- 784 Emerson Dr NE
- 598 Aviation Ave NE
- 499 Bayard Ave NE
- 482 Filbert Ave NE
- 478 Fillmore Ave NE
- 471 Americana Blvd NE
- 154 Nemo Cir NE
- 711 Hunan St NE
- 914 Sierra Place NE
- 298 Driskell St NE Unit Ne
- 298 Driskell St NE
- 280 Naylor St NE
- 291 Naylor St NE
- 286 Driskell St NE
- 290 Naylor St NE
- 270 Naylor St NE
- 281 Dickinson St NE
- 261 Naylor St NE
- 295 Driskell St NE
- 274 Driskell St NE
- 360 Neptune Dr NE
- 781 Hughes Ave NE
- 350 Neptune Dr NE
- 271 Dickinson St NE
- 380 Neptune Dr NE
- 251 Naylor St NE
- 351 Nesbitt St NE
- 331 Nesbitt St NE
- 271 Driskell St NE