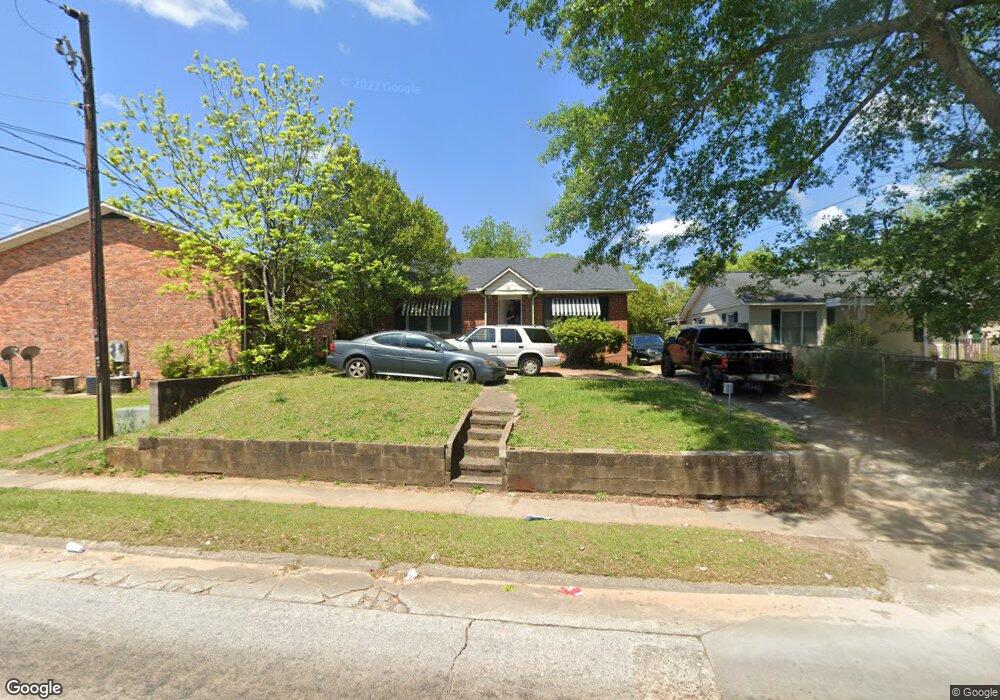
281 Park St Macon, GA 31210
Estimated Value: $107,000 - $118,000
2
Beds
1
Bath
970
Sq Ft
$114/Sq Ft
Est. Value
About This Home
This home is located at 281 Park St, Macon, GA 31210 and is currently estimated at $110,109, approximately $113 per square foot. 281 Park St is a home located in Bibb County with nearby schools including Carter Elementary School, Howard Middle School, and Howard High School.
Ownership History
Date
Name
Owned For
Owner Type
Purchase Details
Closed on
Apr 24, 2025
Sold by
Jcsa Llc
Bought by
Spo Investment Properties Llc
Current Estimated Value
Home Financials for this Owner
Home Financials are based on the most recent Mortgage that was taken out on this home.
Original Mortgage
$86,250
Outstanding Balance
$84,418
Interest Rate
5.8%
Mortgage Type
New Conventional
Estimated Equity
$25,691
Purchase Details
Closed on
Mar 4, 2019
Sold by
Heart Of Georgia Properties Llc
Bought by
Rep Lllp
Purchase Details
Closed on
Jan 14, 2014
Sold by
Heart Of Georgia Properties Llc
Bought by
Rep Lllp
Purchase Details
Closed on
Mar 2, 2011
Sold by
Salter James S
Bought by
Heart Of Georgia Properties Llc
Purchase Details
Closed on
Jan 14, 2004
Bought by
Heart Of Georgia Llc
Purchase Details
Closed on
Nov 3, 1998
Create a Home Valuation Report for This Property
The Home Valuation Report is an in-depth analysis detailing your home's value as well as a comparison with similar homes in the area
Home Values in the Area
Average Home Value in this Area
Purchase History
| Date | Buyer | Sale Price | Title Company |
|---|---|---|---|
| Spo Investment Properties Llc | $115,000 | None Listed On Document | |
| Spo Investment Properties Llc | $115,000 | None Listed On Document | |
| Rep Lllp | -- | None Available | |
| Rep Lllp | -- | None Available | |
| Heart Of Georgia Properties Llc | -- | -- | |
| Heart Of Georgia Llc | $44,000 | -- | |
| -- | $15,200 | -- |
Source: Public Records
Mortgage History
| Date | Status | Borrower | Loan Amount |
|---|---|---|---|
| Open | Spo Investment Properties Llc | $86,250 | |
| Closed | Spo Investment Properties Llc | $86,250 |
Source: Public Records
Tax History Compared to Growth
Tax History
| Year | Tax Paid | Tax Assessment Tax Assessment Total Assessment is a certain percentage of the fair market value that is determined by local assessors to be the total taxable value of land and additions on the property. | Land | Improvement |
|---|---|---|---|---|
| 2025 | $451 | $18,344 | $910 | $17,434 |
| 2024 | $466 | $18,344 | $910 | $17,434 |
| 2023 | $543 | $18,344 | $910 | $17,434 |
| 2022 | $471 | $13,603 | $3,254 | $10,349 |
| 2021 | $485 | $12,762 | $2,766 | $9,996 |
| 2020 | $385 | $9,922 | $2,278 | $7,644 |
| 2019 | $365 | $9,334 | $2,278 | $7,056 |
| 2018 | $810 | $10,510 | $2,278 | $8,232 |
| 2017 | $394 | $10,510 | $2,278 | $8,232 |
| 2016 | $364 | $10,510 | $2,278 | $8,232 |
| 2015 | $515 | $10,510 | $2,278 | $8,232 |
| 2014 | $592 | $10,510 | $2,278 | $8,232 |
Source: Public Records
Map
Nearby Homes
- 3848 Berkley Dr
- 162 Parkwood Ave
- 3940 Grand Ave
- 3698 Berkley Dr
- 4403 Azalea Dr
- 3831 Fairmont Ave
- 4433 Azalea Dr
- 4373 Barrington Place
- 3949 Bernice Ave
- 3861 Grand Ave
- 209 Forest Hill Rd
- 1402 Barrington Place
- 1406 Barrington Place
- 4571 Shadow Lawn Dr
- 227 Forest Hill Rd
- 4057 Brookdale Ave
- 3855 Mercer St
- 4058 Brookdale Ave
- 4532 Ayers Rd
- 3775 Grand Ave