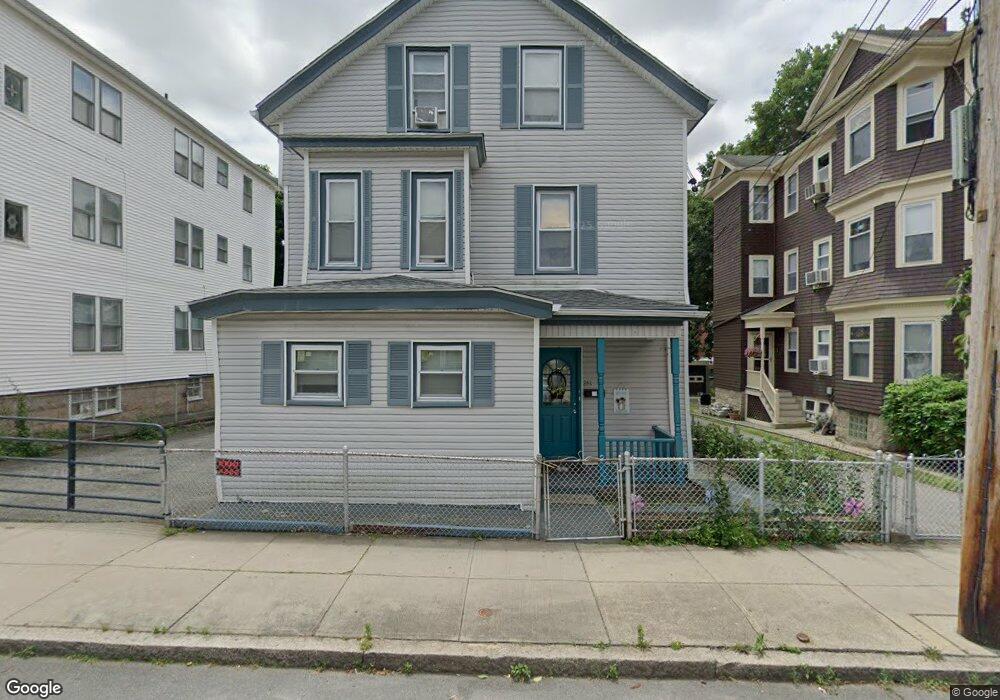
281 Peckham St Fall River, MA 02724
Father Kelly NeighborhoodEstimated Value: $411,000 - $522,000
4
Beds
2
Baths
1,843
Sq Ft
$246/Sq Ft
Est. Value
About This Home
This home is located at 281 Peckham St, Fall River, MA 02724 and is currently estimated at $453,927, approximately $246 per square foot. 281 Peckham St is a home located in Bristol County with nearby schools including Henry Lord Community School, B M C Durfee High School, and Argosy Collegiate Charter School.
Ownership History
Date
Name
Owned For
Owner Type
Purchase Details
Closed on
Jun 18, 2003
Sold by
Soares Admilson
Bought by
Montecinos Cristobal and Alvarado Santos E
Current Estimated Value
Home Financials for this Owner
Home Financials are based on the most recent Mortgage that was taken out on this home.
Original Mortgage
$220,210
Interest Rate
5.71%
Mortgage Type
Purchase Money Mortgage
Purchase Details
Closed on
Dec 10, 1996
Sold by
Denham Ruth and Mello Christine
Bought by
Yentz Eric M and Yentz Vanesa M
Home Financials for this Owner
Home Financials are based on the most recent Mortgage that was taken out on this home.
Original Mortgage
$111,787
Interest Rate
7.83%
Mortgage Type
Purchase Money Mortgage
Purchase Details
Closed on
Aug 5, 1988
Sold by
Doyle Lucienne Est
Bought by
Denham Ruth
Create a Home Valuation Report for This Property
The Home Valuation Report is an in-depth analysis detailing your home's value as well as a comparison with similar homes in the area
Home Values in the Area
Average Home Value in this Area
Purchase History
| Date | Buyer | Sale Price | Title Company |
|---|---|---|---|
| Montecinos Cristobal | $225,000 | -- | |
| Yentz Eric M | $111,000 | -- | |
| Denham Ruth | $110,000 | -- |
Source: Public Records
Mortgage History
| Date | Status | Borrower | Loan Amount |
|---|---|---|---|
| Open | Denham Ruth | $265,500 | |
| Closed | Denham Ruth | $220,210 | |
| Previous Owner | Denham Ruth | $11,784 | |
| Previous Owner | Denham Ruth | $111,787 |
Source: Public Records
Tax History
| Year | Tax Paid | Tax Assessment Tax Assessment Total Assessment is a certain percentage of the fair market value that is determined by local assessors to be the total taxable value of land and additions on the property. | Land | Improvement |
|---|---|---|---|---|
| 2025 | $4,361 | $380,900 | $109,300 | $271,600 |
| 2024 | $3,987 | $347,000 | $105,200 | $241,800 |
| 2023 | $3,553 | $289,600 | $86,900 | $202,700 |
| 2022 | $3,293 | $260,900 | $82,800 | $178,100 |
| 2021 | $3,061 | $221,300 | $78,800 | $142,500 |
| 2020 | $3,000 | $207,600 | $77,600 | $130,000 |
| 2019 | $2,843 | $195,000 | $74,800 | $120,200 |
| 2018 | $2,756 | $188,500 | $81,000 | $107,500 |
| 2017 | $2,500 | $178,600 | $77,200 | $101,400 |
| 2016 | $2,466 | $180,900 | $82,100 | $98,800 |
| 2015 | $2,394 | $183,000 | $82,100 | $100,900 |
| 2014 | $2,389 | $189,900 | $79,700 | $110,200 |
Source: Public Records
Map
Nearby Homes
Your Personal Tour Guide
Ask me questions while you tour the home.