281 S 9th St East Alton, IL 62024
Estimated Value: $295,537 - $362,000
3
Beds
4
Baths
1,608
Sq Ft
$203/Sq Ft
Est. Value
About This Home
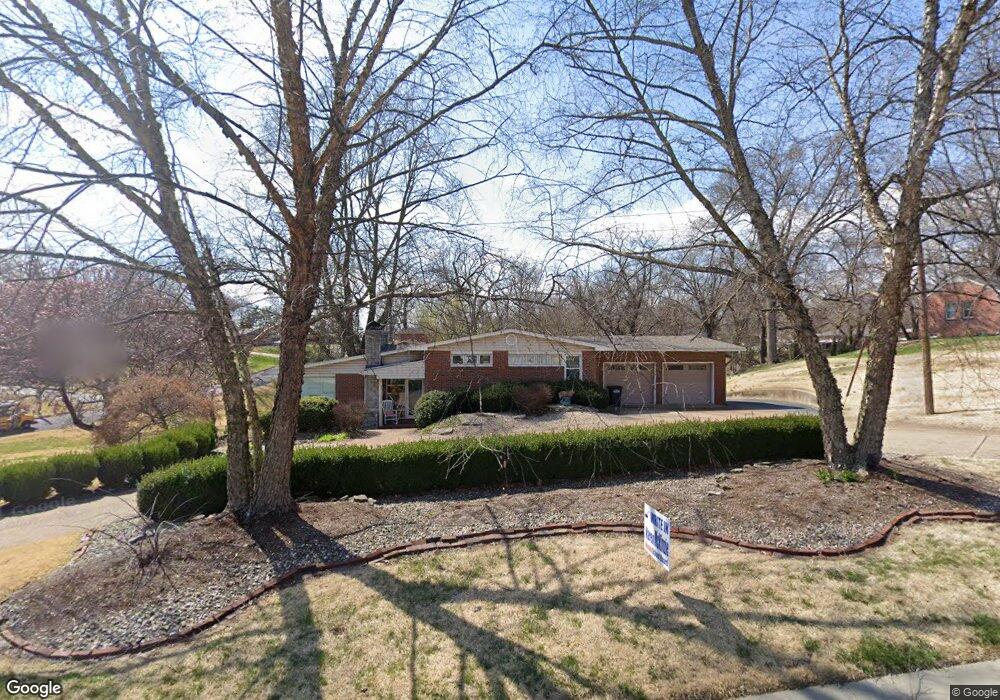
This home is located at 281 S 9th St, East Alton, IL 62024 and is currently estimated at $326,134, approximately $202 per square foot. 281 S 9th St is a home located in Madison County with nearby schools including South Roxana Elementary School, Central Elementary School, and Roxana Junior High School.
Ownership History
Date
Name
Owned For
Owner Type
Purchase Details
Closed on
Jun 12, 2008
Sold by
Dawson Steven M and Dawson Sarah A
Bought by
Hubbard Glenn W and Hubbard Paula A
Current Estimated Value
Home Financials for this Owner
Home Financials are based on the most recent Mortgage that was taken out on this home.
Original Mortgage
$209,000
Outstanding Balance
$134,388
Interest Rate
6.09%
Mortgage Type
Purchase Money Mortgage
Estimated Equity
$191,746
Purchase Details
Closed on
Dec 11, 2004
Sold by
Nevels Donald T and Nevels Cathy
Bought by
Dawson Steven M and Dawson Sarah A
Home Financials for this Owner
Home Financials are based on the most recent Mortgage that was taken out on this home.
Original Mortgage
$179,120
Interest Rate
5.77%
Mortgage Type
Purchase Money Mortgage
Create a Home Valuation Report for This Property
The Home Valuation Report is an in-depth analysis detailing your home's value as well as a comparison with similar homes in the area
Home Values in the Area
Average Home Value in this Area
Purchase History
| Date | Buyer | Sale Price | Title Company |
|---|---|---|---|
| Hubbard Glenn W | $220,000 | Serenity Title & Escrow Ltd | |
| Dawson Steven M | $224,000 | Serenity Title & Escrow Ltd |
Source: Public Records
Mortgage History
| Date | Status | Borrower | Loan Amount |
|---|---|---|---|
| Open | Hubbard Glenn W | $209,000 | |
| Previous Owner | Dawson Steven M | $179,120 | |
| Closed | Dawson Steven M | $44,780 |
Source: Public Records
Tax History Compared to Growth
Tax History
| Year | Tax Paid | Tax Assessment Tax Assessment Total Assessment is a certain percentage of the fair market value that is determined by local assessors to be the total taxable value of land and additions on the property. | Land | Improvement |
|---|---|---|---|---|
| 2024 | $4,907 | $87,470 | $20,360 | $67,110 |
| 2023 | $4,907 | $81,540 | $18,980 | $62,560 |
| 2022 | $4,513 | $75,260 | $17,520 | $57,740 |
| 2021 | $4,197 | $70,150 | $16,330 | $53,820 |
| 2020 | $4,049 | $67,560 | $15,730 | $51,830 |
| 2019 | $3,962 | $65,550 | $15,260 | $50,290 |
| 2018 | $3,871 | $62,290 | $14,500 | $47,790 |
| 2017 | $3,774 | $60,800 | $14,150 | $46,650 |
| 2016 | $3,721 | $60,800 | $14,150 | $46,650 |
| 2015 | $3,574 | $60,160 | $14,000 | $46,160 |
| 2014 | $3,574 | $60,160 | $14,000 | $46,160 |
| 2013 | $3,574 | $61,020 | $14,200 | $46,820 |
Source: Public Records
Map
Nearby Homes