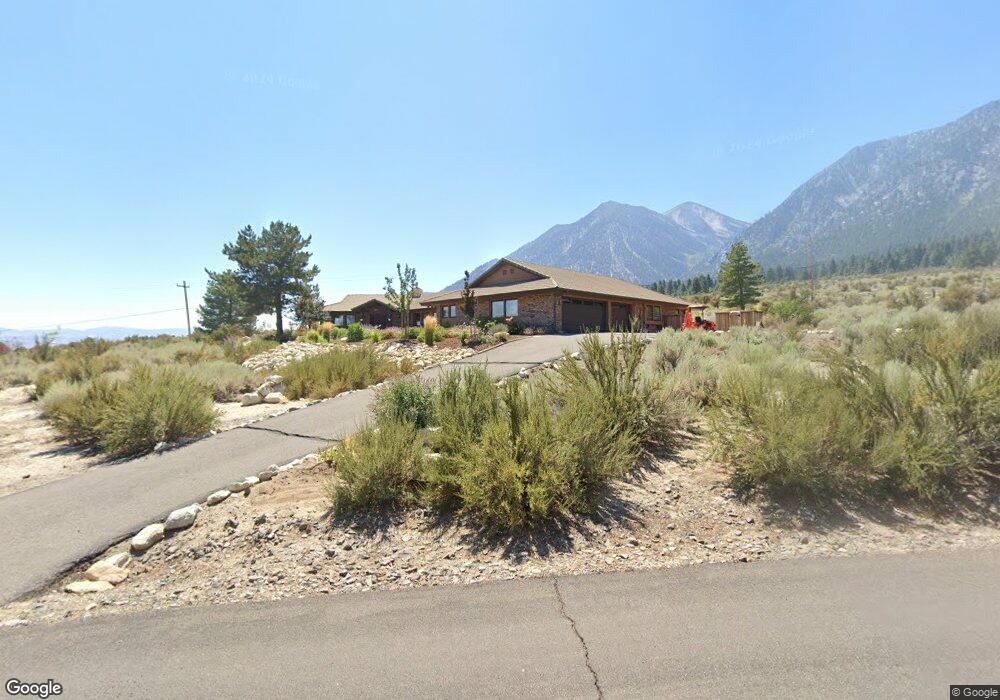
281 Shadow Mountain Rd Gardnerville, NV 89460
Mottsville NeighborhoodEstimated Value: $1,245,000 - $1,352,000
--
Bed
--
Bath
2,740
Sq Ft
$468/Sq Ft
Est. Value
About This Home
This home is located at 281 Shadow Mountain Rd, Gardnerville, NV 89460 and is currently estimated at $1,283,350, approximately $468 per square foot. 281 Shadow Mountain Rd is a home located in Douglas County with nearby schools including Gene Scarselli Elementary School, Pau Wa Lu Middle School, and Douglas County High School.
Ownership History
Date
Name
Owned For
Owner Type
Purchase Details
Closed on
Jun 16, 2025
Sold by
Mark And Anne Thomas Revocable Trust and Thomas Anne
Bought by
Anne Schreiber Thomas Living Trust and Thomas
Current Estimated Value
Purchase Details
Closed on
Apr 10, 2025
Sold by
Mark And Anne Thomas Revocable Trust and Thomas Anne
Bought by
Anne Schreiber Thomas Living Trust and Thomas
Purchase Details
Closed on
Jul 20, 2020
Sold by
Mark And Anne Thomas Revocable Trust and Thomas Mark A
Bought by
Thomas Mark A and Thomas Anne
Home Financials for this Owner
Home Financials are based on the most recent Mortgage that was taken out on this home.
Original Mortgage
$450,000
Interest Rate
2.9%
Mortgage Type
New Conventional
Purchase Details
Closed on
Oct 15, 2015
Sold by
Thomas Mark A and Thomas Anne
Bought by
The Mark And Anne Thomas Revocable Trust
Create a Home Valuation Report for This Property
The Home Valuation Report is an in-depth analysis detailing your home's value as well as a comparison with similar homes in the area
Home Values in the Area
Average Home Value in this Area
Purchase History
| Date | Buyer | Sale Price | Title Company |
|---|---|---|---|
| Anne Schreiber Thomas Living Trust | -- | None Listed On Document | |
| Anne Schreiber Thomas Living Trust | -- | None Listed On Document | |
| Thomas Mark A | -- | None Listed On Document | |
| The Mark And Anne Thomas Revocable Trust | -- | None Available |
Source: Public Records
Mortgage History
| Date | Status | Borrower | Loan Amount |
|---|---|---|---|
| Previous Owner | Thomas Mark A | $450,000 |
Source: Public Records
Tax History Compared to Growth
Tax History
| Year | Tax Paid | Tax Assessment Tax Assessment Total Assessment is a certain percentage of the fair market value that is determined by local assessors to be the total taxable value of land and additions on the property. | Land | Improvement |
|---|---|---|---|---|
| 2025 | $4,997 | $201,727 | $99,750 | $101,977 |
| 2024 | $4,852 | $203,300 | $99,750 | $103,550 |
| 2023 | $4,710 | $194,393 | $96,250 | $98,143 |
| 2022 | $4,710 | $177,443 | $84,000 | $93,443 |
| 2021 | $4,573 | $159,349 | $70,000 | $89,349 |
| 2020 | $4,468 | $158,793 | $70,000 | $88,793 |
| 2019 | $4,338 | $151,159 | $63,000 | $88,159 |
| 2018 | $4,216 | $148,395 | $63,000 | $85,395 |
| 2017 | $4,093 | $144,622 | $57,750 | $86,872 |
| 2016 | $3,990 | $140,884 | $52,500 | $88,384 |
| 2015 | $3,982 | $140,884 | $52,500 | $88,384 |
| 2014 | $3,866 | $136,247 | $52,500 | $83,747 |
Source: Public Records
Map
Nearby Homes
- 1004 Lakeside Dr
- 233 Sierra Country Cir
- 880 Stutler Creek Ct
- 259 Five Creek Rd
- 301 Five Creek Rd
- 1147 Autumn Hills Rd
- 210 Sheridan Creek Ct
- 150 Summit Ridge Way
- 1211 Quail Ridge Rd
- 804 Foothill Rd
- 584 W Fork Vista Ln
- 168 Five Creek Rd
- 1220 Quail Ridge Rd
- 389 Mottsville Ln
- 1272 Kingsbury Grade
- 164 Mott Creek Ln
- 150 Five Creek Rd
- 320 Mottsville Ln
- 123 Five Creek Rd
- 775 Foothill Rd
- 204 Shadow Mountain Rd
- 287 Shadow Mountain Rd
- 305 Shadow Mountain Cir
- 267 Shadow Mountain Rd
- 270 Shadow Mountain Cir
- 270 Shadow Mountain Rd Unit 2
- 290 Shadow Mountain Rd
- 1016 Lakeside Dr
- 201 Shadow Mountain Rd
- 201 Shadow Mountain Rd
- 209 Shadow Mountain Cir
- 209 Shadow Mountain Rd
- 305 Shadow Mountain Rd
- 254 Shadow Mountain Rd
- 1030 Lakeside Dr
- 251 Shadow Mountain Rd
- 232 Shadow Mountain Rd
- 1010 Lakeside Dr
- 229 Shadow Mountain Rd
- 281 Sierra Country Cir