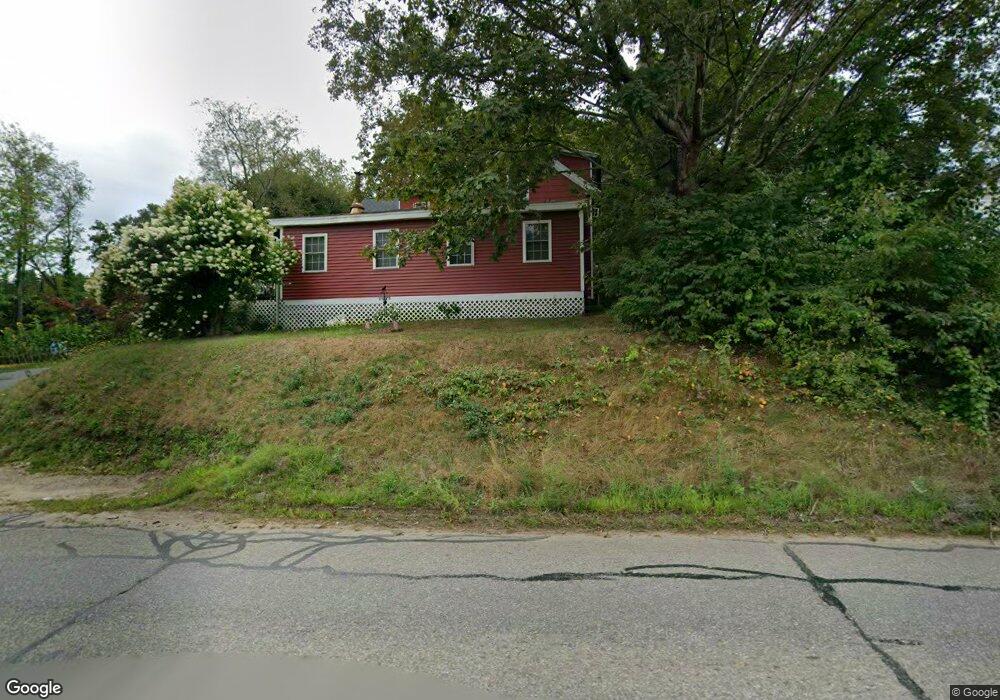
281 Spring St Winchendon, MA 01475
Estimated Value: $303,000 - $454,000
3
Beds
1
Bath
1,663
Sq Ft
$213/Sq Ft
Est. Value
About This Home
This home is located at 281 Spring St, Winchendon, MA 01475 and is currently estimated at $354,362, approximately $213 per square foot. 281 Spring St is a home located in Worcester County with nearby schools including Toy Town Elementary School, Memorial, and The Winchendon School.
Ownership History
Date
Name
Owned For
Owner Type
Purchase Details
Closed on
Mar 13, 2025
Sold by
Greene Susan C
Bought by
Weymouth Daniel M and Weymouth Susan C
Current Estimated Value
Home Financials for this Owner
Home Financials are based on the most recent Mortgage that was taken out on this home.
Original Mortgage
$178,000
Outstanding Balance
$176,351
Interest Rate
6.5%
Mortgage Type
Adjustable Rate Mortgage/ARM
Estimated Equity
$178,011
Purchase Details
Closed on
Aug 17, 1988
Sold by
Williams Richard
Bought by
Greene Susan C
Home Financials for this Owner
Home Financials are based on the most recent Mortgage that was taken out on this home.
Original Mortgage
$95,000
Interest Rate
10.32%
Mortgage Type
Purchase Money Mortgage
Create a Home Valuation Report for This Property
The Home Valuation Report is an in-depth analysis detailing your home's value as well as a comparison with similar homes in the area
Home Values in the Area
Average Home Value in this Area
Purchase History
| Date | Buyer | Sale Price | Title Company |
|---|---|---|---|
| Weymouth Daniel M | -- | None Available | |
| Weymouth Daniel M | -- | None Available | |
| Greene Susan C | $97,000 | -- |
Source: Public Records
Mortgage History
| Date | Status | Borrower | Loan Amount |
|---|---|---|---|
| Open | Weymouth Daniel M | $178,000 | |
| Closed | Weymouth Daniel M | $178,000 | |
| Previous Owner | Greene Susan C | $12,240 | |
| Previous Owner | Greene Susan C | $95,000 |
Source: Public Records
Tax History
| Year | Tax Paid | Tax Assessment Tax Assessment Total Assessment is a certain percentage of the fair market value that is determined by local assessors to be the total taxable value of land and additions on the property. | Land | Improvement |
|---|---|---|---|---|
| 2025 | $3,129 | $266,300 | $35,500 | $230,800 |
| 2024 | $3,012 | $240,200 | $34,100 | $206,100 |
| 2023 | $3,187 | $237,800 | $33,300 | $204,500 |
| 2022 | $3,028 | $200,400 | $41,900 | $158,500 |
| 2021 | $2,724 | $173,300 | $38,200 | $135,100 |
| 2020 | $2,637 | $162,000 | $35,500 | $126,500 |
| 2019 | $2,478 | $148,300 | $32,900 | $115,400 |
| 2018 | $2,318 | $133,600 | $30,700 | $102,900 |
| 2017 | $2,165 | $120,500 | $34,000 | $86,500 |
| 2016 | $2,031 | $116,500 | $32,400 | $84,100 |
| 2015 | $1,948 | $116,500 | $32,400 | $84,100 |
| 2014 | $1,902 | $119,200 | $38,800 | $80,400 |
Source: Public Records
Map
Nearby Homes
- 275 Spring St
- 275 Spring St Unit 2
- 280 Spring St
- 287 Spring St
- 287 Spring St Unit 1
- 286 Spring St
- 272 Spring St
- 263 Spring St
- 290 Spring St
- 274 Spring St
- 259 Spring St
- 260 Spring Cir
- 250 Spring Cir Unit 2
- 250 Spring Cir
- 201 Spring Cir Unit B
- 201 Spring Cir Unit A
- 205 Spring Cir Unit B
- 205 Spring Cir Unit A
- 302 Spring St Unit B
- 302 Spring St Unit A
Your Personal Tour Guide
Ask me questions while you tour the home.