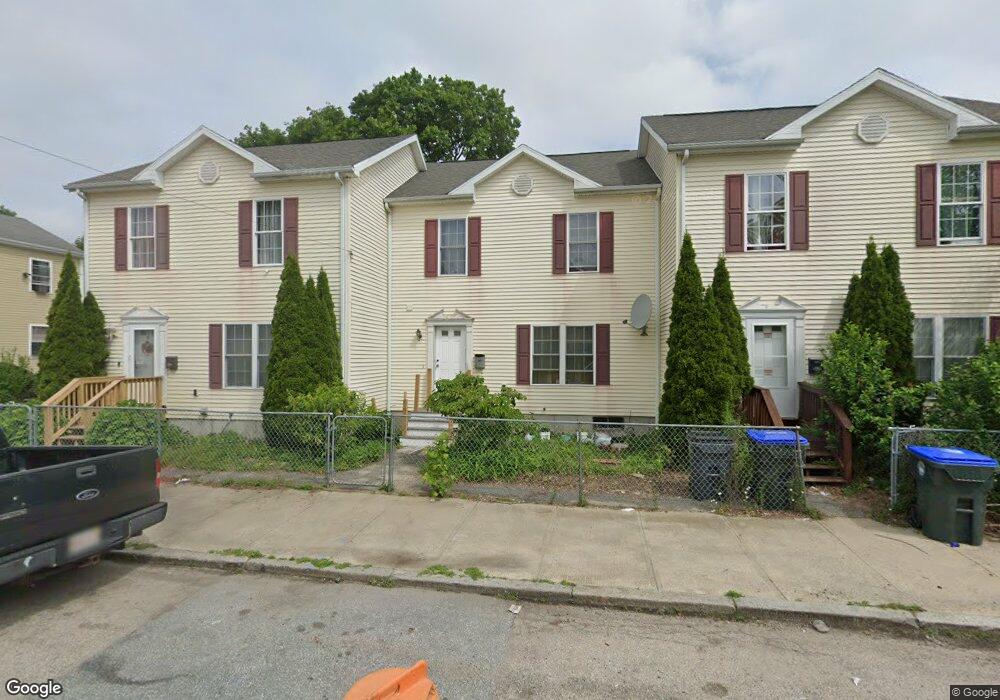
281 Swan St Unit A Providence, RI 02905
Lower South Providence NeighborhoodEstimated Value: $253,000 - $372,387
3
Beds
1
Bath
1,344
Sq Ft
$240/Sq Ft
Est. Value
About This Home
This home is located at 281 Swan St Unit A, Providence, RI 02905 and is currently estimated at $322,347, approximately $239 per square foot. 281 Swan St Unit A is a home located in Providence County with nearby schools including Asa Messer Elementary School, Charles N. Fortes Elementary School, and Robert L. Bailey IV Elementary.
Ownership History
Date
Name
Owned For
Owner Type
Purchase Details
Closed on
Apr 30, 2015
Sold by
Lakavichit Ekkalak and Lee Jasmine P
Bought by
Shestakova Yuliya
Current Estimated Value
Purchase Details
Closed on
Mar 20, 2006
Sold by
Conley Patrick T
Bought by
Lakavichit Ekkalak and Pakoulee Jasmine
Home Financials for this Owner
Home Financials are based on the most recent Mortgage that was taken out on this home.
Original Mortgage
$146,970
Interest Rate
6.27%
Mortgage Type
Purchase Money Mortgage
Create a Home Valuation Report for This Property
The Home Valuation Report is an in-depth analysis detailing your home's value as well as a comparison with similar homes in the area
Home Values in the Area
Average Home Value in this Area
Purchase History
| Date | Buyer | Sale Price | Title Company |
|---|---|---|---|
| Shestakova Yuliya | $112,950 | -- | |
| Lakavichit Ekkalak | $164,000 | -- |
Source: Public Records
Mortgage History
| Date | Status | Borrower | Loan Amount |
|---|---|---|---|
| Previous Owner | Lakavichit Ekkalak | $146,970 |
Source: Public Records
Tax History Compared to Growth
Tax History
| Year | Tax Paid | Tax Assessment Tax Assessment Total Assessment is a certain percentage of the fair market value that is determined by local assessors to be the total taxable value of land and additions on the property. | Land | Improvement |
|---|---|---|---|---|
| 2025 | $6,446 | $441,500 | $0 | $441,500 |
| 2024 | $5,575 | $303,800 | $0 | $303,800 |
| 2023 | $5,575 | $303,800 | $0 | $303,800 |
| 2022 | $5,408 | $303,800 | $0 | $303,800 |
| 2021 | $3,478 | $141,600 | $0 | $141,600 |
| 2020 | $3,478 | $141,600 | $0 | $141,600 |
| 2019 | $3,478 | $141,600 | $0 | $141,600 |
| 2018 | $3,359 | $105,100 | $0 | $105,100 |
| 2017 | $3,359 | $105,100 | $0 | $105,100 |
| 2016 | $3,359 | $105,100 | $0 | $105,100 |
| 2015 | $2,641 | $79,800 | $0 | $79,800 |
| 2014 | $2,693 | $79,800 | $0 | $79,800 |
| 2013 | $2,693 | $79,800 | $0 | $79,800 |
Source: Public Records
Map
Nearby Homes