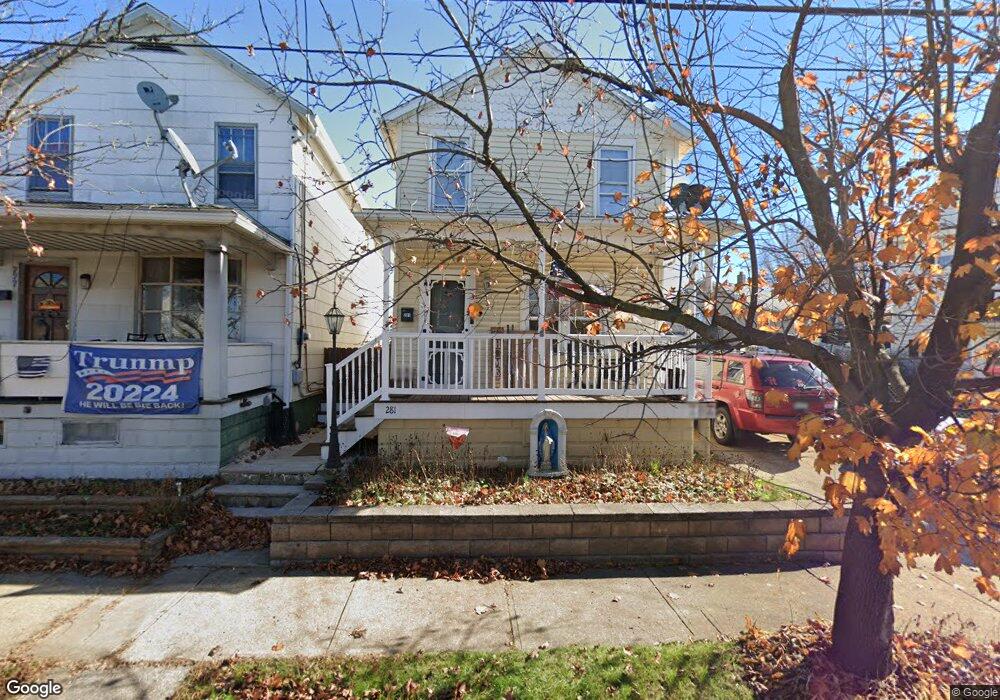
281 W Main St Nanticoke, PA 18634
Estimated Value: $71,000 - $142,000
--
Bed
--
Bath
977
Sq Ft
$109/Sq Ft
Est. Value
About This Home
This home is located at 281 W Main St, Nanticoke, PA 18634 and is currently estimated at $106,820, approximately $109 per square foot. 281 W Main St is a home located in Luzerne County with nearby schools including Kennedy Early Childhood Center, Nanticoke Area Elementary Center Center, and Greater Nanticoke Area Senior High School.
Ownership History
Date
Name
Owned For
Owner Type
Purchase Details
Closed on
Oct 16, 2015
Sold by
Smith Lloyd H and Smith Shelly M
Bought by
Smith Michael R
Current Estimated Value
Home Financials for this Owner
Home Financials are based on the most recent Mortgage that was taken out on this home.
Original Mortgage
$68,000
Outstanding Balance
$53,502
Interest Rate
3.88%
Mortgage Type
New Conventional
Estimated Equity
$53,318
Purchase Details
Closed on
Apr 7, 1998
Bought by
Smith Lloyd H
Create a Home Valuation Report for This Property
The Home Valuation Report is an in-depth analysis detailing your home's value as well as a comparison with similar homes in the area
Home Values in the Area
Average Home Value in this Area
Purchase History
| Date | Buyer | Sale Price | Title Company |
|---|---|---|---|
| Smith Michael R | $85,000 | Attorney | |
| Smith Lloyd H | -- | -- |
Source: Public Records
Mortgage History
| Date | Status | Borrower | Loan Amount |
|---|---|---|---|
| Open | Smith Michael R | $68,000 |
Source: Public Records
Tax History Compared to Growth
Tax History
| Year | Tax Paid | Tax Assessment Tax Assessment Total Assessment is a certain percentage of the fair market value that is determined by local assessors to be the total taxable value of land and additions on the property. | Land | Improvement |
|---|---|---|---|---|
| 2025 | $1,221 | $46,800 | $19,900 | $26,900 |
| 2024 | $1,221 | $46,800 | $19,900 | $26,900 |
| 2023 | $1,204 | $46,800 | $19,900 | $26,900 |
| 2022 | $1,149 | $46,800 | $19,900 | $26,900 |
| 2021 | $1,124 | $46,800 | $19,900 | $26,900 |
| 2020 | $1,124 | $46,800 | $19,900 | $26,900 |
| 2019 | $1,114 | $46,800 | $19,900 | $26,900 |
| 2018 | $1,095 | $46,800 | $19,900 | $26,900 |
| 2017 | $1,075 | $46,800 | $19,900 | $26,900 |
| 2016 | $358 | $46,800 | $19,900 | $26,900 |
| 2015 | $513 | $46,800 | $19,900 | $26,900 |
| 2014 | $513 | $46,800 | $19,900 | $26,900 |
Source: Public Records
Map
Nearby Homes