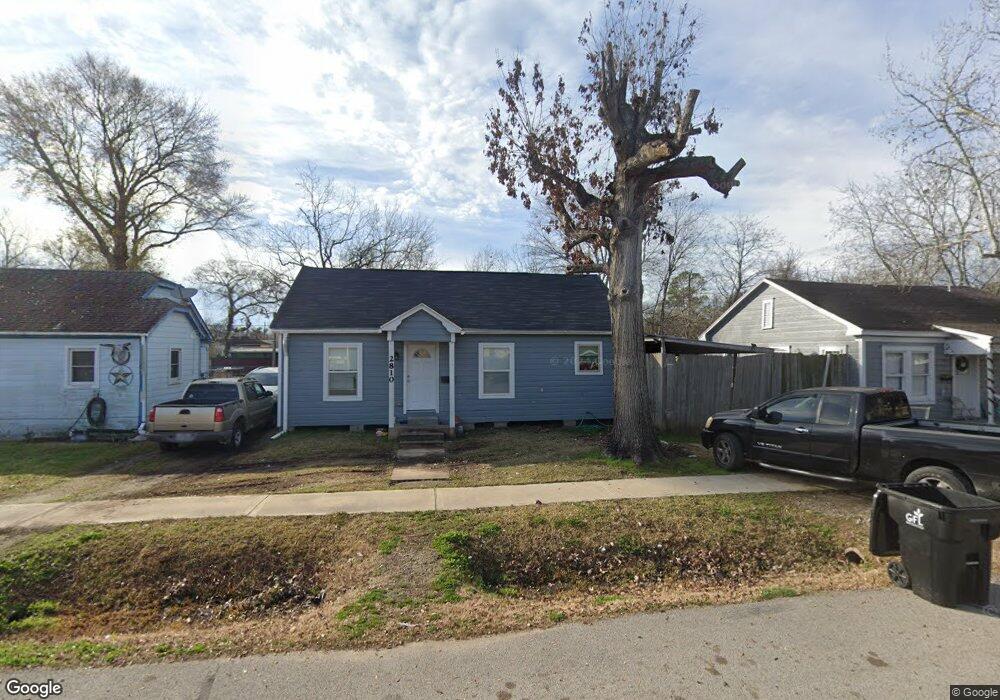
2810 Avenue F Rosenberg, TX 77471
Estimated Value: $135,617 - $200,000
1
Bed
1
Bath
962
Sq Ft
$176/Sq Ft
Est. Value
About This Home
This home is located at 2810 Avenue F, Rosenberg, TX 77471 and is currently estimated at $169,539, approximately $176 per square foot. 2810 Avenue F is a home located in Fort Bend County with nearby schools including Travis Elementary School, Navarro Middle School, and George Junior High School.
Ownership History
Date
Name
Owned For
Owner Type
Purchase Details
Closed on
Aug 16, 2023
Sold by
Perez Santos Lara and Perez Guadalupe Nieto
Bought by
Perez Family Trust and Serrano
Current Estimated Value
Purchase Details
Closed on
Jul 19, 2019
Sold by
Olsen John R
Bought by
Perez Juan Carlos and Perez Jaime
Purchase Details
Closed on
Apr 21, 1999
Sold by
Hill Herbert O and Hill Ann Marie
Bought by
Seebach Donald Wayne
Purchase Details
Closed on
Aug 27, 1996
Sold by
Hill Herbert O
Bought by
Hill Glen H
Create a Home Valuation Report for This Property
The Home Valuation Report is an in-depth analysis detailing your home's value as well as a comparison with similar homes in the area
Home Values in the Area
Average Home Value in this Area
Purchase History
| Date | Buyer | Sale Price | Title Company |
|---|---|---|---|
| Perez Family Trust | -- | None Listed On Document | |
| Perez Juan Carlos | -- | None Available | |
| Seebach Donald Wayne | -- | -- | |
| Hill Glen H | -- | -- |
Source: Public Records
Tax History Compared to Growth
Tax History
| Year | Tax Paid | Tax Assessment Tax Assessment Total Assessment is a certain percentage of the fair market value that is determined by local assessors to be the total taxable value of land and additions on the property. | Land | Improvement |
|---|---|---|---|---|
| 2025 | $2,376 | $99,818 | $26,398 | $73,420 |
| 2024 | $2,376 | $125,792 | $26,398 | $99,394 |
| 2023 | $2,454 | $127,113 | $26,398 | $100,715 |
| 2022 | $1,657 | $80,920 | $26,400 | $54,520 |
| 2021 | $1,004 | $48,390 | $15,840 | $32,550 |
| 2020 | $993 | $46,800 | $15,840 | $30,960 |
| 2019 | $1,069 | $46,810 | $15,840 | $30,970 |
| 2018 | $1,044 | $44,960 | $15,840 | $29,120 |
| 2017 | $1,024 | $43,890 | $15,840 | $28,050 |
| 2016 | $1,026 | $43,940 | $15,840 | $28,100 |
| 2015 | $168 | $44,060 | $15,840 | $28,220 |
| 2014 | $309 | $44,050 | $15,840 | $28,210 |
Source: Public Records
Map
Nearby Homes