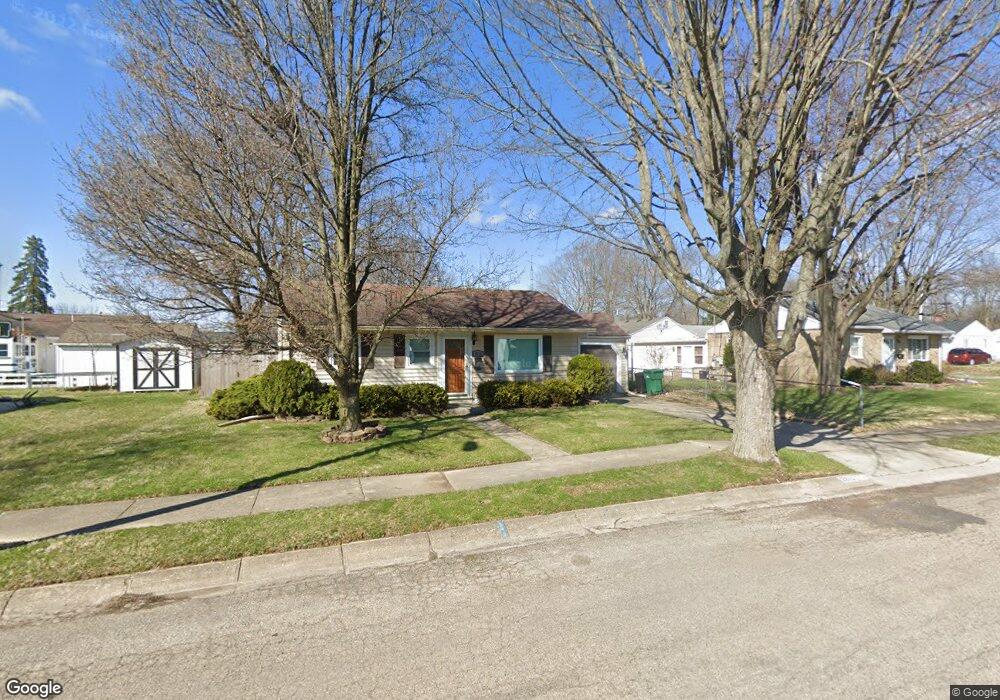
2810 Duncan St Springfield, OH 45505
Estimated Value: $149,000 - $223,000
3
Beds
1
Bath
1,658
Sq Ft
$113/Sq Ft
Est. Value
About This Home
This home is located at 2810 Duncan St, Springfield, OH 45505 and is currently estimated at $187,291, approximately $112 per square foot. 2810 Duncan St is a home located in Clark County with nearby schools including Mann Elementary School, Schaefer Middle School, and Springfield High School.
Ownership History
Date
Name
Owned For
Owner Type
Purchase Details
Closed on
Aug 27, 2015
Sold by
Raulston Christopher P and Raulston Jessica
Bought by
Carroll Barbara K
Current Estimated Value
Home Financials for this Owner
Home Financials are based on the most recent Mortgage that was taken out on this home.
Original Mortgage
$71,581
Outstanding Balance
$55,854
Interest Rate
4.04%
Mortgage Type
FHA
Estimated Equity
$131,437
Purchase Details
Closed on
Jan 24, 2000
Sold by
Yates Ronald L and Yates Sandra E
Bought by
Raulston Christopher P and Raulston Jessica
Home Financials for this Owner
Home Financials are based on the most recent Mortgage that was taken out on this home.
Original Mortgage
$75,961
Interest Rate
7.81%
Mortgage Type
FHA
Purchase Details
Closed on
Oct 13, 1987
Create a Home Valuation Report for This Property
The Home Valuation Report is an in-depth analysis detailing your home's value as well as a comparison with similar homes in the area
Home Values in the Area
Average Home Value in this Area
Purchase History
| Date | Buyer | Sale Price | Title Company |
|---|---|---|---|
| Carroll Barbara K | $73,000 | Attorney | |
| Raulston Christopher P | $76,000 | -- | |
| -- | $36,000 | -- |
Source: Public Records
Mortgage History
| Date | Status | Borrower | Loan Amount |
|---|---|---|---|
| Open | Carroll Barbara K | $71,581 | |
| Previous Owner | Raulston Christopher P | $75,961 |
Source: Public Records
Tax History
| Year | Tax Paid | Tax Assessment Tax Assessment Total Assessment is a certain percentage of the fair market value that is determined by local assessors to be the total taxable value of land and additions on the property. | Land | Improvement |
|---|---|---|---|---|
| 2025 | $2,626 | $51,010 | $4,900 | $46,110 |
| 2024 | $2,011 | $41,690 | $4,590 | $37,100 |
| 2023 | $2,011 | $41,690 | $4,590 | $37,100 |
| 2022 | $2,060 | $41,690 | $4,590 | $37,100 |
| 2021 | $1,535 | $28,710 | $3,150 | $25,560 |
| 2020 | $1,539 | $28,710 | $3,150 | $25,560 |
| 2019 | $1,542 | $28,710 | $3,150 | $25,560 |
| 2018 | $1,105 | $19,760 | $2,630 | $17,130 |
| 2017 | $1,105 | $19,622 | $2,629 | $16,993 |
| 2016 | $1,106 | $19,622 | $2,629 | $16,993 |
| 2015 | $1,101 | $18,999 | $2,629 | $16,370 |
| 2014 | $1,096 | $18,999 | $2,629 | $16,370 |
| 2013 | $1,085 | $18,999 | $2,629 | $16,370 |
Source: Public Records
Map
Nearby Homes
- 2670 Duncan St
- 2804 Lowman St
- 1011 Mount Joy St
- 3154 Sherwood Park Dr
- 3012 E High St
- 360 Buxton Ave
- 2560 Kenton St
- 2338 Dellwood Dr
- 374 Raffensperger Ave
- 138 Lawnview Ave
- 121 Willis Ave
- 2425 Kenilworth Ave
- 115 S Burnett Rd
- 400 S Arlington Ave Unit 402
- 2702 Maplewood Ave
- 273 S Clairmont Ave
- 2424-2426 E High St
- 2111 Kenilworth Ave
- 250 S Douglas Ave Unit 254
- 129 N Burnett Rd
Your Personal Tour Guide
Ask me questions while you tour the home.