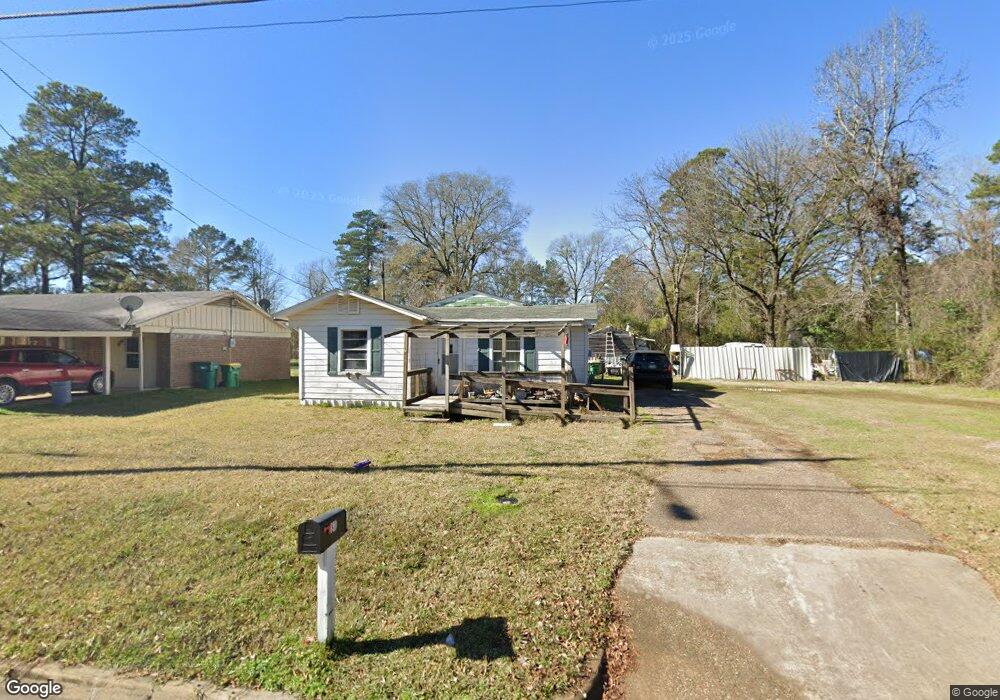
2810 Flower Acre Rd Texarkana, TX 75501
Estimated Value: $80,641 - $141,000
--
Bed
--
Bath
1,024
Sq Ft
$121/Sq Ft
Est. Value
About This Home
This home is located at 2810 Flower Acre Rd, Texarkana, TX 75501 and is currently estimated at $123,410, approximately $120 per square foot. 2810 Flower Acre Rd is a home located in Bowie County with nearby schools including Liberty-Eylau Early Childhood Center, Liberty-Eylau Primary School, and Liberty-Eylau C.K. Bender Elementary Campus.
Ownership History
Date
Name
Owned For
Owner Type
Purchase Details
Closed on
May 12, 2016
Sold by
Barling Cudy
Bought by
Steven C J
Current Estimated Value
Home Financials for this Owner
Home Financials are based on the most recent Mortgage that was taken out on this home.
Original Mortgage
$31,377
Interest Rate
3.65%
Mortgage Type
VA
Purchase Details
Closed on
Mar 18, 2016
Sold by
Hatridge & Patton Llc
Bought by
Stevens Calvin J
Home Financials for this Owner
Home Financials are based on the most recent Mortgage that was taken out on this home.
Original Mortgage
$31,377
Interest Rate
3.65%
Mortgage Type
VA
Purchase Details
Closed on
May 22, 2013
Sold by
King Roger Madison
Bought by
Hatridge & Patton Llc
Create a Home Valuation Report for This Property
The Home Valuation Report is an in-depth analysis detailing your home's value as well as a comparison with similar homes in the area
Home Values in the Area
Average Home Value in this Area
Purchase History
| Date | Buyer | Sale Price | Title Company |
|---|---|---|---|
| Steven C J | -- | None Available | |
| Stevens Calvin J | -- | Ups Env Title Source Inc | |
| Hatridge & Patton Llc | -- | None Available |
Source: Public Records
Mortgage History
| Date | Status | Borrower | Loan Amount |
|---|---|---|---|
| Previous Owner | Stevens Calvin J | $31,377 |
Source: Public Records
Tax History Compared to Growth
Tax History
| Year | Tax Paid | Tax Assessment Tax Assessment Total Assessment is a certain percentage of the fair market value that is determined by local assessors to be the total taxable value of land and additions on the property. | Land | Improvement |
|---|---|---|---|---|
| 2025 | $363 | $46,294 | $10,000 | $36,294 |
| 2024 | $363 | $44,934 | $10,000 | $34,934 |
| 2023 | $896 | $42,399 | $10,000 | $32,399 |
| 2022 | $915 | $39,003 | $10,000 | $29,003 |
| 2021 | $958 | $38,295 | $10,000 | $28,295 |
| 2020 | $930 | $36,983 | $10,000 | $26,983 |
| 2019 | $964 | $36,896 | $10,000 | $26,896 |
| 2018 | $938 | $35,887 | $10,000 | $25,887 |
| 2017 | $922 | $35,394 | $10,000 | $25,394 |
| 2016 | $973 | $37,340 | $10,000 | $27,340 |
| 2015 | $569 | $37,078 | $10,000 | $27,078 |
| 2014 | $569 | $22,696 | $10,000 | $12,696 |
Source: Public Records
Map
Nearby Homes
- 2802 Flower Acre Rd
- 2120 Flower Acre Rd
- 2615 Leopard Dr
- 2501 Leopard Dr
- 1215 S Lake Dr
- 1801 S Lake Dr
- 3305 S Lake Dr
- 3007 Hollywood St
- 3009 Post St
- 3007 Post St
- Pansy st Loop 151
- 2803 Johnson Ln
- TBD Lp Frontage Wallace Pkwy
- 0 Urban Dr
- 1799 Chelf Rd
- 5 S Watlington Dr
- 1407 S Lake Dr
- 2 S Pineview Dr
- N/A Kramer Cr 1326
- 3610 Davis St
- 2806 Flower Acre Rd
- 2812 Flower Acre Rd
- 2814 Flower Acre Rd
- 2803 Flower Acre Rd
- 2807 Flower Acre Rd
- 3421 Pickering Ln
- 2524 Flower Acre Rd
- 2523 Flower Acre Rd
- 3422 Pickering Ln
- 2902 Flower Acre Rd
- 2903 Flower Acre Rd
- 3424 Pickering Ln
- 2907 Flower Acre Rd
- 3314 Kidd Ln
- 2917 Flower Acre Rd
- 3320 Kidd Ln
- 3502 Pickering Ln
- 3001 Flower Acre Rd
- 3316 Kidd Ln
- 3312 Kidd Ln