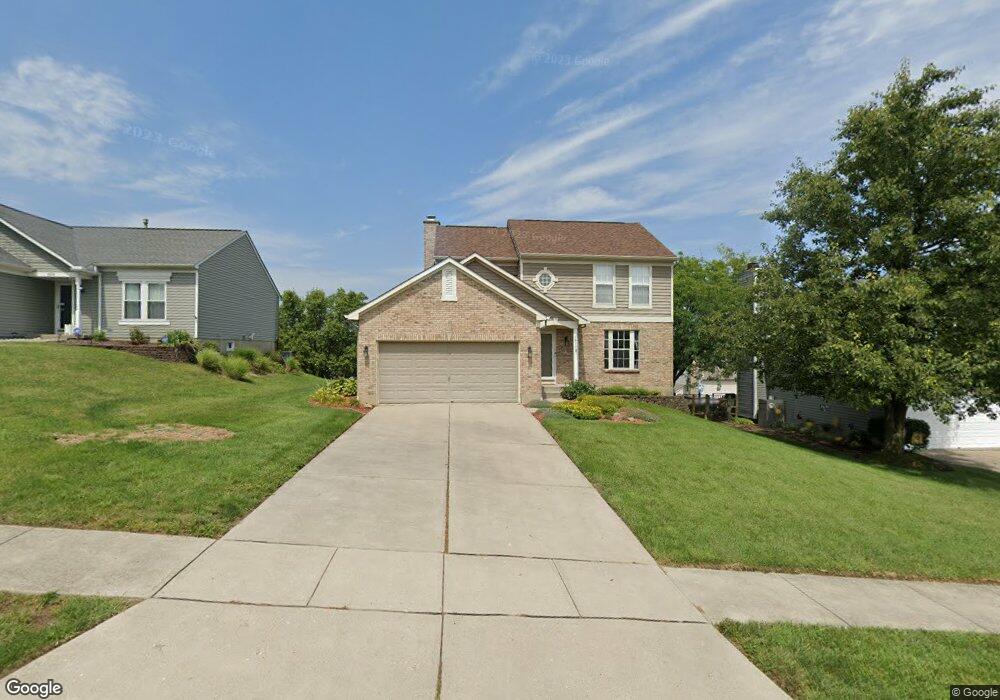
2810 Highcrest Ct Cincinnati, OH 45251
Pleasant Run NeighborhoodEstimated Value: $258,243 - $321,000
3
Beds
3
Baths
1,408
Sq Ft
$201/Sq Ft
Est. Value
About This Home
This home is located at 2810 Highcrest Ct, Cincinnati, OH 45251 and is currently estimated at $282,311, approximately $200 per square foot. 2810 Highcrest Ct is a home located in Hamilton County with nearby schools including Pleasant Run Elementary School, Pleasant Run Middle School, and Northwest High School.
Ownership History
Date
Name
Owned For
Owner Type
Purchase Details
Closed on
Jan 12, 2021
Sold by
Johnson Heather M and Johnson Ian A
Bought by
Johnson Heather M and Johnson Ian A
Current Estimated Value
Home Financials for this Owner
Home Financials are based on the most recent Mortgage that was taken out on this home.
Original Mortgage
$122,000
Outstanding Balance
$86,697
Interest Rate
2.71%
Mortgage Type
New Conventional
Estimated Equity
$195,614
Purchase Details
Closed on
Nov 8, 2011
Sold by
Ddd Restoration Llc
Bought by
Johnson Ian A
Purchase Details
Closed on
Jun 22, 2010
Sold by
Citimortgage Inc
Bought by
Secretary Of Housing & Urban Development
Purchase Details
Closed on
Dec 11, 1997
Sold by
Allred William A and Allred Darlene D
Bought by
Brown Daryl
Home Financials for this Owner
Home Financials are based on the most recent Mortgage that was taken out on this home.
Original Mortgage
$97,137
Interest Rate
7.26%
Mortgage Type
FHA
Create a Home Valuation Report for This Property
The Home Valuation Report is an in-depth analysis detailing your home's value as well as a comparison with similar homes in the area
Home Values in the Area
Average Home Value in this Area
Purchase History
| Date | Buyer | Sale Price | Title Company |
|---|---|---|---|
| Johnson Heather M | -- | None Available | |
| Johnson Heather M | -- | None Listed On Document | |
| Johnson Ian A | -- | -- | |
| Secretary Of Housing & Urban Development | -- | Attorney | |
| Brown Daryl | $116,000 | -- |
Source: Public Records
Mortgage History
| Date | Status | Borrower | Loan Amount |
|---|---|---|---|
| Open | Johnson Heather M | $122,000 | |
| Closed | Johnson Heather M | $122,000 | |
| Previous Owner | Brown Daryl | $97,137 |
Source: Public Records
Tax History
| Year | Tax Paid | Tax Assessment Tax Assessment Total Assessment is a certain percentage of the fair market value that is determined by local assessors to be the total taxable value of land and additions on the property. | Land | Improvement |
|---|---|---|---|---|
| 2025 | $4,155 | $72,080 | $9,839 | $62,241 |
| 2024 | $3,852 | $72,080 | $9,839 | $62,241 |
| 2023 | $3,875 | $72,080 | $9,839 | $62,241 |
| 2022 | $3,712 | $56,323 | $8,089 | $48,234 |
| 2021 | $3,680 | $56,323 | $8,089 | $48,234 |
| 2020 | $3,719 | $56,323 | $8,089 | $48,234 |
| 2019 | $3,214 | $45,423 | $6,524 | $38,899 |
| 2018 | $2,883 | $45,423 | $6,524 | $38,899 |
| 2017 | $2,732 | $45,423 | $6,524 | $38,899 |
| 2016 | $3,090 | $50,750 | $8,127 | $42,623 |
| 2015 | $3,121 | $50,750 | $8,127 | $42,623 |
| 2014 | $3,126 | $50,750 | $8,127 | $42,623 |
| 2013 | $2,588 | $44,114 | $8,554 | $35,560 |
Source: Public Records
Map
Nearby Homes
- 11586 Pippin Rd
- 2465 Owlcrest Dr
- 11835 Wincanton Dr
- 11717 Hamilton Ave
- 11911 Pippin Rd
- 11484 Ravensburg Ct
- 2617 Chesterhill Dr
- 11992 Pippin Rd
- 3206 Rothesay Ct
- 2171 Rangoon Ct
- 3330 Celedon Ct
- 11995 Wincanton Dr
- 2163 Broadhurst Ave
- 12161 Birchgrove Ct
- 12080 Regency Run Ct Unit 4
- 2776 Klondike Ct
- 2017 Broadhurst Ave
- 12120 Regency Run Ct
- 6375 Jamesfield Ct
- 12190 Kilbride Dr
- 2800 Highcrest Ct
- 2818 Highcrest Ct
- 11604 Willowcrest Ct
- 2792 Highcrest Ct
- 11610 Willowcrest Ct
- 2826 Highcrest Ct
- 11616 Willowcrest Ct
- 2809 Highcrest Ct
- 2817 Highcrest Ct
- 2801 Highcrest Ct
- 2784 Highcrest Ct
- 11600 Willowcrest Ct
- 2825 Highcrest Ct
- 11568 Greenridge Dr
- 2791 Highcrest Ct
- 11620 Willowcrest Ct
- 11572 Greenridge Dr
- 2835 Highcrest Ct
- 2780 Highcrest Ct
- 11576 Greenridge Dr
Your Personal Tour Guide
Ask me questions while you tour the home.