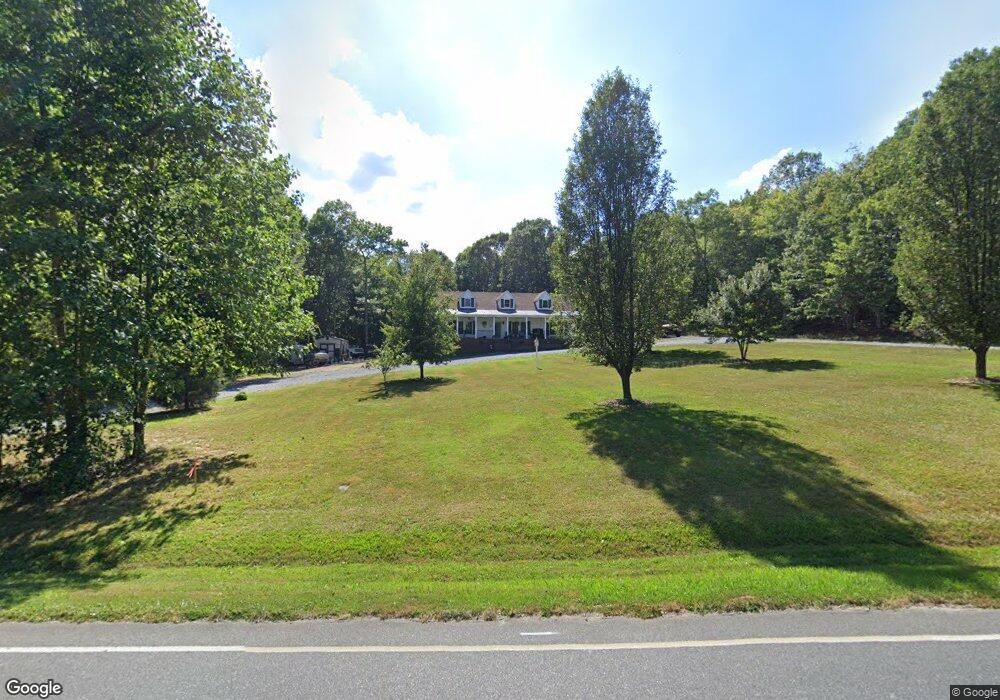
2810 Mack Rd Asheboro, NC 27205
Estimated Value: $275,000 - $348,000
3
Beds
2
Baths
1,624
Sq Ft
$195/Sq Ft
Est. Value
About This Home
This home is located at 2810 Mack Rd, Asheboro, NC 27205 and is currently estimated at $316,961, approximately $195 per square foot. 2810 Mack Rd is a home located in Randolph County with nearby schools including Sycamore Elementary School, Southmont Elementary School, and Southwestern Randolph Middle School.
Ownership History
Date
Name
Owned For
Owner Type
Purchase Details
Closed on
May 23, 2018
Sold by
Clark Bobbie G and Clark Derek L
Bought by
Park Gregory A and Park Megan S
Current Estimated Value
Home Financials for this Owner
Home Financials are based on the most recent Mortgage that was taken out on this home.
Original Mortgage
$165,000
Outstanding Balance
$143,284
Interest Rate
4.87%
Mortgage Type
Adjustable Rate Mortgage/ARM
Estimated Equity
$173,677
Purchase Details
Closed on
Jan 16, 2004
Sold by
Clark Bobbie D Gray and Gray Bobbie D
Bought by
Clark Bobbie G and Clark Derek L
Home Financials for this Owner
Home Financials are based on the most recent Mortgage that was taken out on this home.
Original Mortgage
$122,000
Interest Rate
5.85%
Mortgage Type
New Conventional
Create a Home Valuation Report for This Property
The Home Valuation Report is an in-depth analysis detailing your home's value as well as a comparison with similar homes in the area
Home Values in the Area
Average Home Value in this Area
Purchase History
| Date | Buyer | Sale Price | Title Company |
|---|---|---|---|
| Park Gregory A | $165,000 | None Available | |
| Clark Bobbie G | -- | -- |
Source: Public Records
Mortgage History
| Date | Status | Borrower | Loan Amount |
|---|---|---|---|
| Open | Park Gregory A | $165,000 | |
| Previous Owner | Clark Bobbie G | $122,000 |
Source: Public Records
Tax History Compared to Growth
Tax History
| Year | Tax Paid | Tax Assessment Tax Assessment Total Assessment is a certain percentage of the fair market value that is determined by local assessors to be the total taxable value of land and additions on the property. | Land | Improvement |
|---|---|---|---|---|
| 2025 | $1,521 | $244,530 | $41,830 | $202,700 |
| 2024 | $1,521 | $244,530 | $41,830 | $202,700 |
| 2023 | $1,521 | $244,530 | $41,830 | $202,700 |
| 2022 | $1,224 | $161,990 | $25,800 | $136,190 |
| 2021 | $1,109 | $146,660 | $25,800 | $120,860 |
| 2020 | $1,065 | $146,660 | $25,800 | $120,860 |
| 2019 | $1,065 | $146,660 | $25,800 | $120,860 |
| 2018 | $962 | $129,150 | $23,220 | $105,930 |
| 2016 | $937 | $129,154 | $23,220 | $105,934 |
| 2015 | $940 | $129,154 | $23,220 | $105,934 |
| 2014 | $928 | $129,154 | $23,220 | $105,934 |
Source: Public Records
Map
Nearby Homes
- 1522 Hopewell Friends Rd
- 2500 Westgate Rd
- 1624 Ashbrook View Ln
- 0 Danny Bell Rd
- 708 Dawson Miller Rd
- 1676 Mack Rd
- 1575 Leslie St
- 0 Muriel Ln
- 00 Route 220 Hwy
- Promenade Plan at The Villas at Pinewood
- Portico Plan at The Villas at Pinewood
- Torino Plan at The Villas at Pinewood
- Wellington Plan at The Villas at Pinewood
- 1564 Walker Rd
- o Southmont Dr
- 2272 Doul Mountain Rd
- 2634 Fox Ridge Rd
- 2626 Fox Ridge Rd
- 2318 Doul Mountain Rd
- 0 Fox Ridge Rd Unit 1197775
- 2795 Mack Rd
- 2884 Mack Rd
- 2771 Mack Rd
- 2745 Mack Rd
- 2946 Mack Rd
- 2952 Mack Rd
- 2980 Mack Rd
- 1546 Hopewell Friends Rd
- 2996 Mack Rd
- 2662 Mack Rd
- 1196 Parker Dr
- 2627 Mack Rd
- 1696 Hopewell Friends Rd
- 1520 Hopewell Friends Rd
- 3082 Mack Rd
- 1266 Parker Dr
- 1271 Parker Dr
- 1606 Hopewell Friends Rd
- 1654 Hopewell Friends Rd
- 1622 Hopewell Friends Rd