2810 Parnell Springs Ct Unit 2 Cumming, GA 30040
Estimated Value: $407,000 - $434,000
3
Beds
2
Baths
1,590
Sq Ft
$262/Sq Ft
Est. Value
About This Home
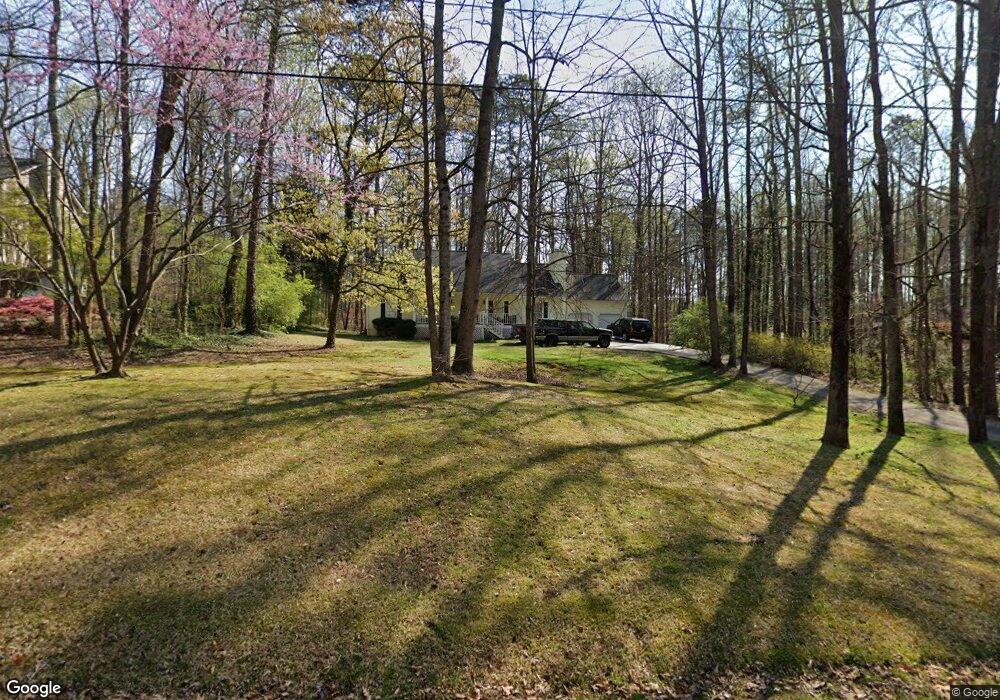
This home is located at 2810 Parnell Springs Ct Unit 2, Cumming, GA 30040 and is currently estimated at $417,299, approximately $262 per square foot. 2810 Parnell Springs Ct Unit 2 is a home located in Forsyth County with nearby schools including Sawnee Elementary School, West Forsyth High School, and Milton Montessori School.
Ownership History
Date
Name
Owned For
Owner Type
Purchase Details
Closed on
May 26, 2015
Sold by
Humphrey Gregory L
Bought by
Humphrey Gregory L and Humphrey Lori A
Current Estimated Value
Home Financials for this Owner
Home Financials are based on the most recent Mortgage that was taken out on this home.
Original Mortgage
$176,892
Outstanding Balance
$134,113
Interest Rate
3.25%
Mortgage Type
FHA
Estimated Equity
$283,186
Purchase Details
Closed on
Feb 26, 2010
Sold by
Smith Theron S
Bought by
Gabriel Adam
Home Financials for this Owner
Home Financials are based on the most recent Mortgage that was taken out on this home.
Original Mortgage
$156,120
Interest Rate
5.5%
Mortgage Type
FHA
Purchase Details
Closed on
Sep 17, 2004
Sold by
Johnson Michael C and Johnson Kimberly
Bought by
Smith Theron S and Smith Doris
Create a Home Valuation Report for This Property
The Home Valuation Report is an in-depth analysis detailing your home's value as well as a comparison with similar homes in the area
Home Values in the Area
Average Home Value in this Area
Purchase History
| Date | Buyer | Sale Price | Title Company |
|---|---|---|---|
| Humphrey Gregory L | -- | -- | |
| Humphrey Gregory L | $183,000 | -- | |
| Gabriel Adam | $159,000 | -- | |
| Smith Theron S | $173,000 | -- |
Source: Public Records
Mortgage History
| Date | Status | Borrower | Loan Amount |
|---|---|---|---|
| Open | Humphrey Gregory L | $176,892 | |
| Previous Owner | Gabriel Adam | $156,120 |
Source: Public Records
Tax History Compared to Growth
Tax History
| Year | Tax Paid | Tax Assessment Tax Assessment Total Assessment is a certain percentage of the fair market value that is determined by local assessors to be the total taxable value of land and additions on the property. | Land | Improvement |
|---|---|---|---|---|
| 2025 | $3,613 | $146,312 | $54,000 | $92,312 |
| 2024 | $3,613 | $147,356 | $48,000 | $99,356 |
| 2023 | $3,700 | $150,332 | $52,000 | $98,332 |
| 2022 | $3,248 | $96,060 | $26,000 | $70,060 |
| 2021 | $2,653 | $96,060 | $26,000 | $70,060 |
| 2020 | $2,571 | $93,116 | $24,000 | $69,116 |
| 2019 | $2,378 | $85,976 | $20,000 | $65,976 |
| 2018 | $2,002 | $72,396 | $20,000 | $52,396 |
| 2017 | $1,888 | $68,044 | $20,000 | $48,044 |
| 2016 | $1,888 | $68,044 | $20,000 | $48,044 |
| 2015 | $1,530 | $58,184 | $16,000 | $42,184 |
| 2014 | $1,363 | $54,776 | $16,000 | $38,776 |
Source: Public Records
Map
Nearby Homes
- 2840 Bryant Ct
- 3735 Westhaven Dr
- 0 Bethelview Rd Unit 10600103
- 0 Bethelview Rd Unit 7645827
- 0 Bethelview Rd Unit 7598310
- 0 Bethelview Rd Unit 7130265
- 0 Bethelview Rd Unit 10102046
- 3735 Hazel Ave
- 3705 Westhaven Dr
- 3340 Chamblee Gap Rd
- 2810 Brookfield Cir
- 4440 Aaronmoor Ln
- 3305 Cove Creek Ln
- 2610 Misty Hollow Ln
- 3505 Knobcone Dr
- 2455 Westlington Cir
- 2880 Westlington Cir
- 2850 Willow Bend Dr
- 2405 Boxwalking Ct
- 2425 Barley Crest Pass
- 2810 Parnell Springs Ct
- 2602 Dogwood Ln
- 2820 Parnell Springs Ct
- 2830 Parnell Springs Ct
- 2570 Dogwood Ln
- 2589 Dogwood Ln
- 2715 Parnell Springs Ct
- 2717 Dogwood Ln
- 2840 Parnell Springs Ct
- 2835 Parnell Springs Ct
- 2820 Bryant Ct
- 2544 Dogwood Ln
- 2745 Dogwood Ln
- 2728 Dogwood Ln
- 2850 Parnell Springs Ct
- 2845 Parnell Springs Ct
- 2830 Bryant Ct
- 2752 Dogwood Ln
- 2845 Bryant Ct
- 2738 Dogwood Ln