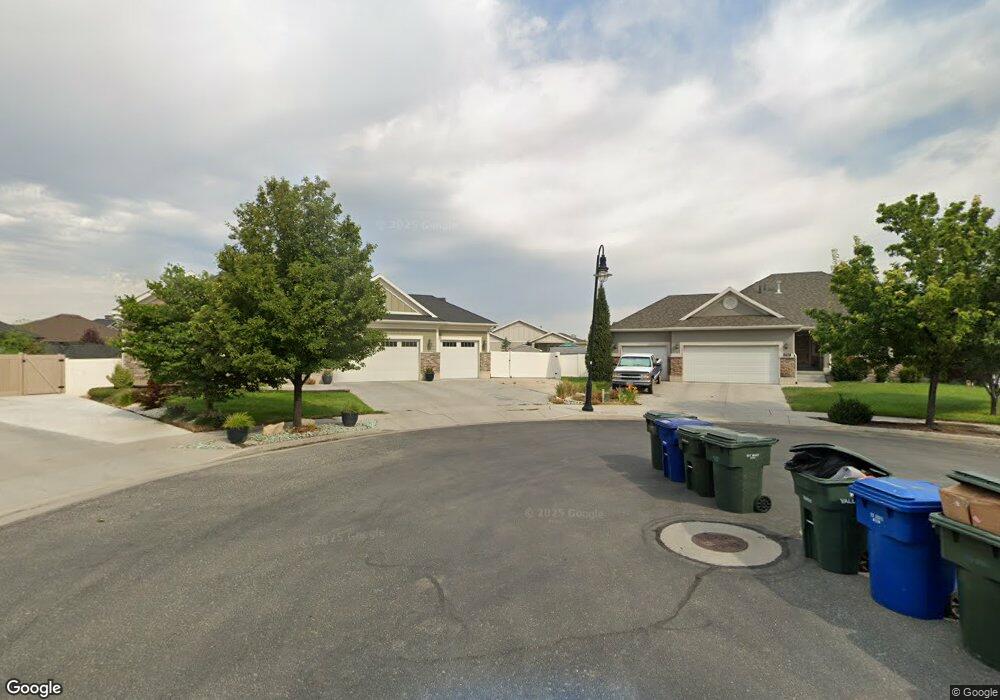
2810 S Harrow Ct West Valley City, UT 84120
Glendale NeighborhoodEstimated Value: $644,000 - $669,000
5
Beds
4
Baths
2,706
Sq Ft
$243/Sq Ft
Est. Value
About This Home
This home is located at 2810 S Harrow Ct, West Valley City, UT 84120 and is currently estimated at $657,450, approximately $242 per square foot. 2810 S Harrow Ct is a home located in Salt Lake County with nearby schools including Neil Armstrong Academy, West Lake Junior High School, and Granger High School.
Ownership History
Date
Name
Owned For
Owner Type
Purchase Details
Closed on
Jan 20, 2023
Sold by
Botero-Montoya Paulo A and Botero-Montoya Iris Carolina
Bought by
Chhour Ov Leng and Khie Kim Hour
Current Estimated Value
Purchase Details
Closed on
Aug 6, 2020
Sold by
Botero Montoya Paulo A
Bought by
Botero Montoya Paulo A and Botero Iris Carolina
Home Financials for this Owner
Home Financials are based on the most recent Mortgage that was taken out on this home.
Original Mortgage
$400,000
Interest Rate
3.1%
Purchase Details
Closed on
May 15, 2015
Sold by
Ivory Homes Ltd
Bought by
Botero-Montoya Paulo A
Home Financials for this Owner
Home Financials are based on the most recent Mortgage that was taken out on this home.
Original Mortgage
$336,073
Interest Rate
3.64%
Mortgage Type
VA
Create a Home Valuation Report for This Property
The Home Valuation Report is an in-depth analysis detailing your home's value as well as a comparison with similar homes in the area
Home Values in the Area
Average Home Value in this Area
Purchase History
| Date | Buyer | Sale Price | Title Company |
|---|---|---|---|
| Chhour Ov Leng | -- | Truly Title | |
| Botero Montoya Paulo A | -- | Eagle Gate Title Ins Agcy | |
| Botero-Montoya Paulo A | -- | Cottonwood Title | |
| Ivory Homes Ltd | -- | Cottonwood Title |
Source: Public Records
Mortgage History
| Date | Status | Borrower | Loan Amount |
|---|---|---|---|
| Previous Owner | Botero Montoya Paulo A | $400,000 | |
| Previous Owner | Ivory Homes Ltd | $336,073 |
Source: Public Records
Tax History Compared to Growth
Tax History
| Year | Tax Paid | Tax Assessment Tax Assessment Total Assessment is a certain percentage of the fair market value that is determined by local assessors to be the total taxable value of land and additions on the property. | Land | Improvement |
|---|---|---|---|---|
| 2025 | -- | $632,100 | $154,800 | $477,300 |
| 2024 | -- | $588,200 | $146,000 | $442,200 |
| 2023 | $3,756 | $548,900 | $134,600 | $414,300 |
| 2022 | $3,599 | $527,400 | $130,700 | $396,700 |
| 2021 | $3,193 | $420,500 | $101,000 | $319,500 |
| 2020 | $3,090 | $384,000 | $89,100 | $294,900 |
| 2019 | $3,571 | $428,000 | $89,100 | $338,900 |
| 2018 | $3,422 | $396,200 | $70,300 | $325,900 |
| 2017 | $3,117 | $366,900 | $70,300 | $296,600 |
| 2016 | $2,948 | $347,600 | $64,700 | $282,900 |
| 2015 | $2,276 | $255,500 | $79,100 | $176,400 |
| 2014 | -- | $55,600 | $55,600 | $0 |
Source: Public Records
Map
Nearby Homes
- 2808 Brixham Way W
- 3017 Jamboree St Unit 12
- 2947 S Calypso St
- 3057 S Finsbury Ln
- 3083 S Finsbury Ln
- 3174 S Park Commons Way
- 3115 S 4880 W
- 2868 S Ritter Row
- 2853 S Kinsey Ct Unit 46
- 2858 S Ritter Row Unit 51
- 2858 S Ritter Row
- 2865 S Ritter Row Unit 55
- 2857 S Ritter Row Unit 57
- 3217 S 4840 W
- 4697 W Woodcutter Ln
- 2892 Malcolm Place Unit 13
- 3043 Arthurs Ct
- 2830 S Keltic Ct
- 4678 W 3100 S
- 4863 W 3280 S
- 2816 S Harrow Ct
- 2804 S Harrow Ct
- 2833 S Brixham Way
- 2825 S Brixham Way
- 2839 S Brixham Way
- 2817 S Brixham Way
- 2797 S Harrow Ct
- 5199 W Dartford Way
- 2801 S Harrow Ct
- 5191 W Dartford Way
- 2811 S Harrow Ct
- 5183 W Dartford Way
- 5159 W Sandwell Dr
- 5147 W Sandwell Dr
- 5167 W Sandwell Dr
- 5177 W Dartford Way
- 2836 S Brixham Way
- 2844 S Brixham Way
- 5137 W Sandwell Dr
- 2830 S Brixham Way