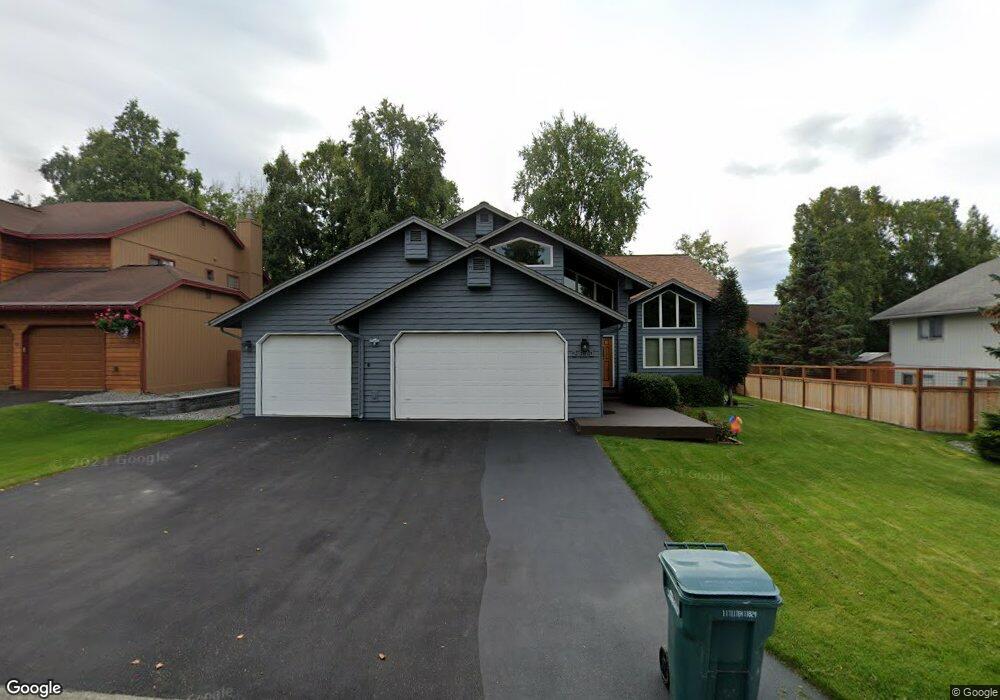
2810 Seafarer Loop Anchorage, AK 99516
Huffman-O'Malley NeighborhoodEstimated Value: $577,000 - $659,000
5
Beds
3
Baths
2,872
Sq Ft
$219/Sq Ft
Est. Value
About This Home
This home is located at 2810 Seafarer Loop, Anchorage, AK 99516 and is currently estimated at $628,813, approximately $218 per square foot. 2810 Seafarer Loop is a home located in Anchorage Municipality with nearby schools including Rabbit Creek Elementary School, Goldenview Middle School, and South Anchorage High School.
Ownership History
Date
Name
Owned For
Owner Type
Purchase Details
Closed on
Mar 2, 2001
Sold by
Wethington William Barry and Wethington Kerri Lee
Bought by
Jackson John M and Jackson Nanette S
Current Estimated Value
Home Financials for this Owner
Home Financials are based on the most recent Mortgage that was taken out on this home.
Original Mortgage
$217,000
Outstanding Balance
$75,273
Interest Rate
7.06%
Estimated Equity
$553,540
Purchase Details
Closed on
Jul 26, 1995
Sold by
Worthington Waldo R and Worthington Margaret A
Bought by
Wethington William Barry and Wethington Kerri Lee
Home Financials for this Owner
Home Financials are based on the most recent Mortgage that was taken out on this home.
Original Mortgage
$196,000
Interest Rate
7.62%
Mortgage Type
New Conventional
Purchase Details
Closed on
May 29, 1992
Sold by
Worthington Waldo R and Worthington Margaret A
Bought by
Worthington Waldo R and Worthington Margaret A
Home Financials for this Owner
Home Financials are based on the most recent Mortgage that was taken out on this home.
Original Mortgage
$205,600
Interest Rate
8.8%
Mortgage Type
New Conventional
Purchase Details
Closed on
May 30, 1988
Sold by
Bethard Construction Inc
Bought by
Worthington Waldo R and Worthington Margaret B
Home Financials for this Owner
Home Financials are based on the most recent Mortgage that was taken out on this home.
Original Mortgage
$199,850
Interest Rate
10.19%
Mortgage Type
New Conventional
Create a Home Valuation Report for This Property
The Home Valuation Report is an in-depth analysis detailing your home's value as well as a comparison with similar homes in the area
Home Values in the Area
Average Home Value in this Area
Purchase History
| Date | Buyer | Sale Price | Title Company |
|---|---|---|---|
| Jackson John M | -- | -- | |
| Wethington William Barry | -- | -- | |
| Wethington William Barry | -- | -- | |
| Worthington Waldo R | -- | -- | |
| Worthington Waldo R | -- | -- | |
| Worthington Waldo R | -- | -- | |
| Worthington Waldo R | -- | -- |
Source: Public Records
Mortgage History
| Date | Status | Borrower | Loan Amount |
|---|---|---|---|
| Open | Jackson John M | $217,000 | |
| Previous Owner | Wethington William Barry | $196,000 | |
| Previous Owner | Worthington Waldo R | $205,600 | |
| Previous Owner | Worthington Waldo R | $199,850 |
Source: Public Records
Tax History
| Year | Tax Paid | Tax Assessment Tax Assessment Total Assessment is a certain percentage of the fair market value that is determined by local assessors to be the total taxable value of land and additions on the property. | Land | Improvement |
|---|---|---|---|---|
| 2025 | $8,145 | $617,400 | $121,000 | $496,400 |
| 2024 | $8,145 | $579,500 | $121,000 | $458,500 |
| 2023 | $9,094 | $534,000 | $121,000 | $413,000 |
| 2022 | $7,543 | $497,900 | $121,000 | $376,900 |
| 2021 | $8,527 | $473,200 | $121,000 | $352,200 |
| 2020 | $7,130 | $469,700 | $121,000 | $348,700 |
| 2019 | $6,843 | $468,300 | $121,000 | $347,300 |
| 2018 | $6,588 | $451,700 | $121,000 | $330,700 |
| 2017 | $6,687 | $447,000 | $121,000 | $326,000 |
| 2016 | $6,181 | $484,500 | $121,000 | $363,500 |
| 2015 | $6,181 | $457,600 | $121,000 | $336,600 |
| 2014 | $6,181 | $439,600 | $119,900 | $319,700 |
Source: Public Records
Map
Nearby Homes
- 2860 Seafarer Loop
- 13540 Seachant Cir
- 3210 Starboard Ln
- 13410 Windrush Cir
- 3225 de Armoun Rd
- 2430 Legacy Dr
- 13730 Sunset View St
- 3250 Legacy Dr
- 3540 E 142nd Ave
- 12900 Monterey Cir
- 12901 Monterey Cir
- 2241 Sues Way
- 3751 Eastwind Dr
- 3700 de Armoun Rd
- 12850 Tara Ln
- 15021 Old Seward Hwy
- Lot 102 NW Loc Sault Ave
- 3928 Pyrenean Cir
- 2103 Tributary Cir
- 1548 Cara Loop Unit 5B
- 2806 Seafarer Loop
- 2820 Seafarer Loop
- 2842 Seafarer Loop
- 2830 Seafarer Loop
- 2802 Seafarer Loop
- 2721 Seafarer Loop
- 2711 Seafarer Loop
- 2844 Seafarer Loop
- 2731 Seafarer Loop
- 2701 Seafarer Loop
- 2840 Seafarer Loop
- 2850 Seafarer Loop
- 2741 Seafarer Loop
- 2771 Seafarer Loop
- 2846 Seafarer Loop
- 2761 Seafarer Loop
- 13801 Westwind Dr
- 2781 Seafarer Loop
- 13701 Westwind Dr
- 2730 Cutwater Cir
Your Personal Tour Guide
Ask me questions while you tour the home.