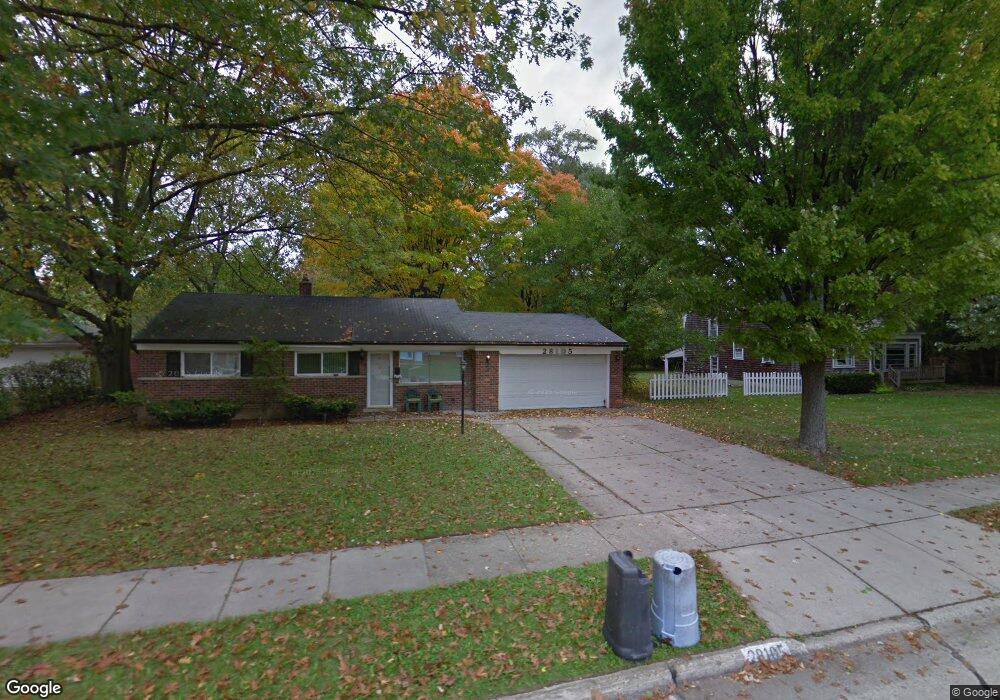
28105 Stuart Ave Southfield, MI 48076
Estimated Value: $233,000 - $258,000
--
Bed
2
Baths
1,464
Sq Ft
$166/Sq Ft
Est. Value
About This Home
This home is located at 28105 Stuart Ave, Southfield, MI 48076 and is currently estimated at $242,671, approximately $165 per square foot. 28105 Stuart Ave is a home located in Oakland County with nearby schools including Vandenberg Elementary School, Thompson K-8 International Baccalaureate Academy, and Crescent Academy Pk-1.
Ownership History
Date
Name
Owned For
Owner Type
Purchase Details
Closed on
Jan 9, 2021
Sold by
Westwood Investment Group Llc
Bought by
Matrix Group Llc
Current Estimated Value
Purchase Details
Closed on
Mar 9, 2020
Sold by
Westwood Investment Group Llc
Bought by
Rivers Tara
Purchase Details
Closed on
Oct 7, 2013
Sold by
Jackson Veronica
Bought by
Westwood Investment Group Llc
Purchase Details
Closed on
Aug 29, 2012
Sold by
Oakland County Treasurer
Bought by
Jackson Veronica
Purchase Details
Closed on
Mar 27, 2006
Sold by
Hussey Hussey M and Hussey Mel
Bought by
Moss Michael and Moss Maurita
Home Financials for this Owner
Home Financials are based on the most recent Mortgage that was taken out on this home.
Original Mortgage
$160,000
Interest Rate
9.52%
Mortgage Type
Fannie Mae Freddie Mac
Purchase Details
Closed on
Oct 21, 1995
Sold by
Hussey Mary Elinor
Bought by
M Elinor Hussey Tr
Create a Home Valuation Report for This Property
The Home Valuation Report is an in-depth analysis detailing your home's value as well as a comparison with similar homes in the area
Home Values in the Area
Average Home Value in this Area
Purchase History
| Date | Buyer | Sale Price | Title Company |
|---|---|---|---|
| Matrix Group Llc | $10,000 | None Available | |
| Rivers Tara | $7,000 | None Available | |
| Westwood Investment Group Llc | $7,000 | None Available | |
| Westwood Investment Group Llc | -- | None Available | |
| Jackson Veronica | $30,000 | None Available | |
| Moss Michael | $160,000 | Metropolitan Title Company | |
| M Elinor Hussey Tr | -- | -- |
Source: Public Records
Mortgage History
| Date | Status | Borrower | Loan Amount |
|---|---|---|---|
| Previous Owner | Moss Michael | $160,000 |
Source: Public Records
Tax History Compared to Growth
Tax History
| Year | Tax Paid | Tax Assessment Tax Assessment Total Assessment is a certain percentage of the fair market value that is determined by local assessors to be the total taxable value of land and additions on the property. | Land | Improvement |
|---|---|---|---|---|
| 2022 | $6,398 | $84,440 | $14,590 | $69,850 |
| 2021 | $6,992 | $68,930 | $9,310 | $59,620 |
| 2020 | $3,744 | $59,940 | $9,310 | $50,630 |
| 2018 | $4,353 | $45,600 | $9,310 | $36,290 |
| 2015 | -- | $38,750 | $0 | $0 |
| 2014 | -- | $29,850 | $0 | $0 |
| 2011 | -- | $31,190 | $0 | $0 |
Source: Public Records
Map
Nearby Homes
- 28249 Red Leaf Ln
- 28405 Stuart Ave
- 28580 Red Leaf Ln
- 28464 Stuart Ave
- 28080 Pierce St
- 27627 Lexington Pkwy
- 27662 Shagbark Dr
- 28174 Sutherland St
- 28426 Sutherland St
- 27714 California Dr NE
- 28521 Sutherland St
- 28060 Aberdeen St
- 28775 Glasgow St
- 28091 Everett St
- 28115 Everett St
- 27244 Spring Arbor Dr
- 27166 Sutherland St
- 15840 Catalpa Dr
- 28723 Everett St
- 27943 Sunset Blvd W
- 28113 Stuart Ave
- 28097 Stuart Ave
- 28262 Red Leaf Ln
- 28254 Red Leaf Ln
- 28242 Red Leaf Ln
- 28327 Stuart Ave
- 28272 Red Leaf Ln
- 28091 Stuart Ave
- 28230 Red Leaf Ln
- 28108 Stuart Ave
- 28104 Stuart Ave
- 28112 Stuart Ave
- 28094 Stuart Ave
- 17141 Wiltshire Blvd
- 28083 Stuart Ave
- 28335 Stuart Ave
- 17151 Wiltshire Blvd
- 28218 Red Leaf Ln
- 28328 Stuart Ave
- 28286 Red Leaf Ln