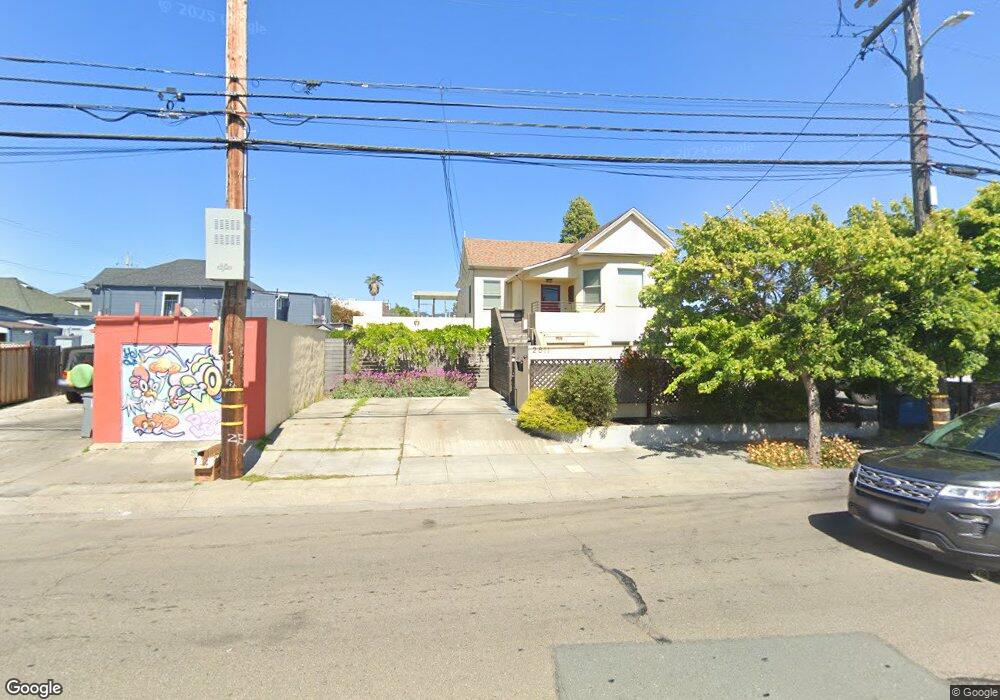
2811 7th St Berkeley, CA 94710
West Berkeley NeighborhoodEstimated Value: $809,000 - $992,000
About This Home
This home is located at 2811 7th St, Berkeley, CA 94710 and is currently estimated at $883,055, approximately $838 per square foot. 2811 7th St is a home located in Alameda County with nearby schools including Malcolm X Elementary School, Oxford Elementary School, and Washington Elementary School.
Ownership History
We collect this data history from publicly available records. To have your information removed, we recommend requesting removal directly through your county’s website.
Purchase Details
Purchase Details
Home Financials for this Owner
Home Financials are based on the most recent Mortgage that was taken out on this home.Home Values in the Area
Average Home Value in this Area
Purchase History
We collect this data history from publicly available records. To have your information removed, we recommend requesting removal directly through your county’s website.
| Date | Buyer | Sale Price | Title Company |
|---|---|---|---|
| -- | None Available | ||
| -- | First California Title Compa |
Mortgage History
We collect this data history from publicly available records. To have your information removed, we recommend requesting removal directly through your county’s website.
| Date | Status | Borrower | Loan Amount |
|---|---|---|---|
| Closed | $70,000 |
Tax History
We collect this data history from publicly available records. To have your information removed, we recommend requesting removal directly through your county’s website.
| Year | Tax Paid | Tax Assessment Tax Assessment Total Assessment is a certain percentage of the fair market value that is determined by local assessors to be the total taxable value of land and additions on the property. | Land | Improvement |
|---|---|---|---|---|
| 2025 | $6,312 | $100,185 | $42,108 | $65,077 |
| 2024 | $6,312 | $98,084 | $41,283 | $63,801 |
| 2023 | $6,076 | $103,023 | $40,473 | $62,550 |
| 2022 | $5,803 | $94,003 | $39,680 | $61,323 |
| 2021 | $5,749 | $92,023 | $38,902 | $60,121 |
| 2020 | $5,219 | $98,008 | $38,503 | $59,505 |
| 2019 | $4,762 | $96,086 | $37,748 | $58,338 |
| 2018 | $4,609 | $94,202 | $37,008 | $57,194 |
| 2017 | $4,418 | $92,355 | $36,282 | $56,073 |
| 2016 | $4,092 | $90,545 | $35,571 | $54,974 |
| 2015 | $4,000 | $89,185 | $35,037 | $54,148 |
| 2014 | $3,842 | $87,439 | $34,351 | $53,088 |
Map
- 2709 10th St Unit C
- 2747 San Pablo Ave Unit 507
- 811 Folger Ave
- 1217 67th St
- 1209 67th St Unit 44
- 1324 Burnett St
- 1314 Ashby Ave
- 1080 67th St
- 1200 65th St Unit 224
- 1086 66th St
- 6501 San Pablo Ave Unit 208
- 6501 San Pablo Ave Unit 410
- 1068 66th St
- 6500 San Pablo Ave
- 6465 San Pablo Ave Unit 203
- 6465 San Pablo Ave Unit 32
- 1164 Ocean Ave
- 2817 Stanton St
- 2790 Sacramento St
- 2782 Sacramento St
Ask me questions while you tour the home.