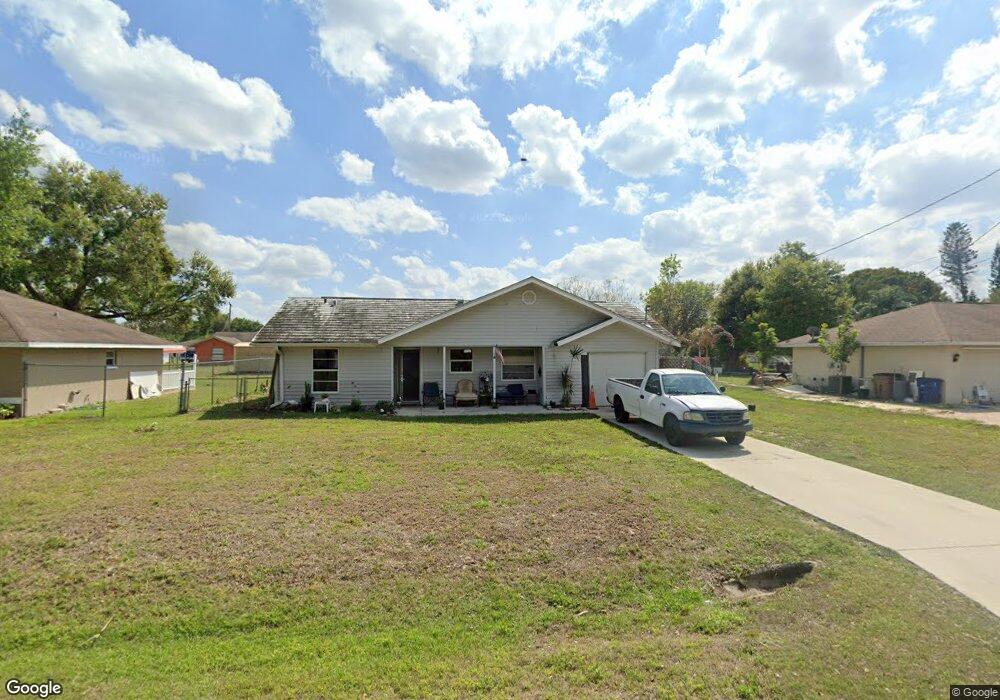
2811 7th St W Unit 6 Lehigh Acres, FL 33971
Richmond NeighborhoodEstimated Value: $231,390 - $287,000
3
Beds
2
Baths
1,163
Sq Ft
$215/Sq Ft
Est. Value
About This Home
This home is located at 2811 7th St W Unit 6, Lehigh Acres, FL 33971 and is currently estimated at $249,848, approximately $214 per square foot. 2811 7th St W Unit 6 is a home located in Lee County with nearby schools including Lehigh Elementary School, Gateway Elementary School, and Tice Elementary School.
Ownership History
Date
Name
Owned For
Owner Type
Purchase Details
Closed on
Jul 22, 2025
Sold by
Cass Bernadine
Bought by
Grant Daniel and Cass Bernadine
Current Estimated Value
Purchase Details
Closed on
Aug 24, 2009
Sold by
Orsini Michael
Bought by
Suncoast Partners Inc
Purchase Details
Closed on
Jun 2, 2007
Sold by
Grant Bryan
Bought by
Cass Bernadine
Purchase Details
Closed on
Jun 1, 2005
Sold by
Roberson Tina
Bought by
Hollingsworth Corrine
Purchase Details
Closed on
May 28, 2005
Sold by
Ingram Brandi
Bought by
Hollingsworth Corrine
Purchase Details
Closed on
May 10, 2005
Sold by
Rodriguez Billie
Bought by
Hollingsworth Corrine
Purchase Details
Closed on
May 16, 2003
Sold by
Menkes Adam L
Bought by
Llanio Rosa
Purchase Details
Closed on
Jun 13, 2002
Sold by
Waffle Douglas K
Bought by
Grant Bryan
Home Financials for this Owner
Home Financials are based on the most recent Mortgage that was taken out on this home.
Original Mortgage
$74,290
Interest Rate
6.77%
Create a Home Valuation Report for This Property
The Home Valuation Report is an in-depth analysis detailing your home's value as well as a comparison with similar homes in the area
Home Values in the Area
Average Home Value in this Area
Purchase History
| Date | Buyer | Sale Price | Title Company |
|---|---|---|---|
| Grant Daniel | -- | None Listed On Document | |
| Suncoast Partners Inc | $39,400 | None Available | |
| Cass Bernadine | $72,000 | Attorney | |
| Hollingsworth Corrine | -- | -- | |
| Hollingsworth Corrine | -- | -- | |
| Hollingsworth Corrine | -- | -- | |
| Hollingsworth Corrine | -- | -- | |
| Llanio Rosa | $2,900 | -- | |
| Grant Bryan | $78,200 | -- |
Source: Public Records
Mortgage History
| Date | Status | Borrower | Loan Amount |
|---|---|---|---|
| Previous Owner | Grant Bryan | $74,290 |
Source: Public Records
Tax History Compared to Growth
Tax History
| Year | Tax Paid | Tax Assessment Tax Assessment Total Assessment is a certain percentage of the fair market value that is determined by local assessors to be the total taxable value of land and additions on the property. | Land | Improvement |
|---|---|---|---|---|
| 2025 | $2,486 | $122,740 | -- | -- |
| 2024 | $2,486 | $111,582 | -- | -- |
| 2023 | $2,212 | $101,438 | $0 | $0 |
| 2022 | $1,988 | $92,216 | $0 | $0 |
| 2021 | $1,699 | $103,311 | $12,751 | $90,560 |
| 2020 | $1,590 | $95,284 | $5,200 | $90,084 |
| 2019 | $1,639 | $95,280 | $5,300 | $89,980 |
| 2018 | $1,551 | $88,019 | $5,000 | $83,019 |
| 2017 | $1,462 | $81,566 | $5,000 | $76,566 |
| 2016 | $1,364 | $72,635 | $6,191 | $66,444 |
| 2015 | $1,266 | $62,905 | $4,720 | $58,185 |
| 2014 | -- | $54,699 | $3,787 | $50,912 |
| 2013 | -- | $43,402 | $3,314 | $40,088 |
Source: Public Records
Map
Nearby Homes
- 2809 7th St W
- 2813 7th St W
- 2810 6th St W
- 2807 7th St W
- 2815 7th St W
- 2808 6th St W
- 2812 6th St W
- 2812 7th St W Unit 6
- 2806 6th St W
- 2814 6th St W Unit 6
- 2806 7th St W
- 2814 7th St W
- 2805 7th St W
- 2805 7th St W
- 2816 6th St W Unit 6
- 2804 7th St W
- 2804 6th St W
- 2816 7th St W
- 2811 8th St W
- 2808 7th St W