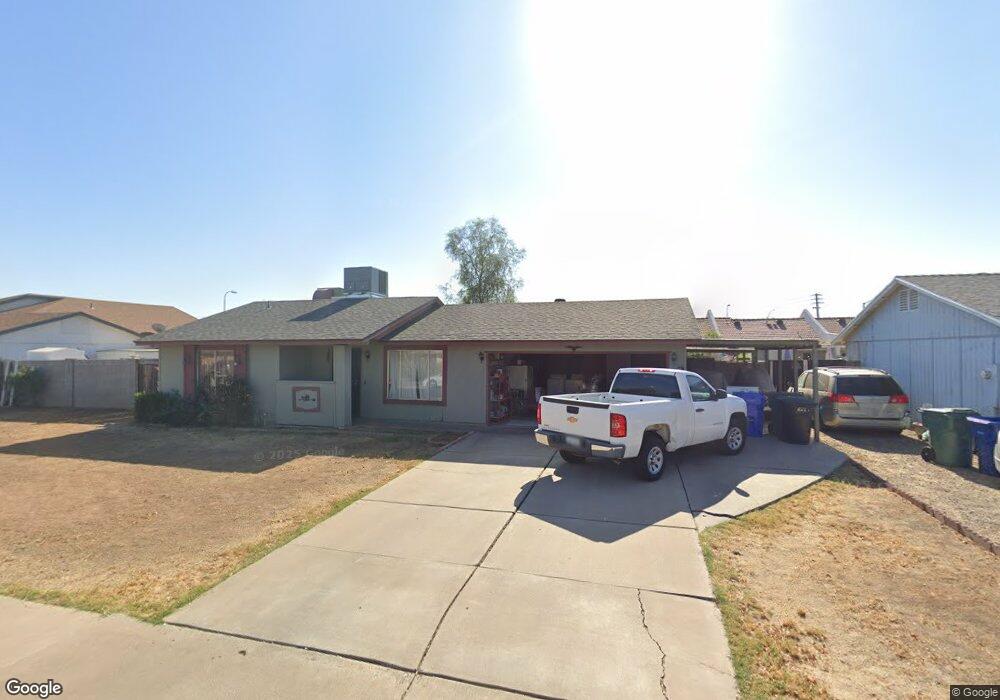
2811 E Javelina Ave Mesa, AZ 85204
Central Mesa NeighborhoodEstimated Value: $290,000 - $445,000
Studio
1
Bath
1,403
Sq Ft
$270/Sq Ft
Est. Value
About This Home
This home is located at 2811 E Javelina Ave, Mesa, AZ 85204 and is currently estimated at $378,242, approximately $269 per square foot. 2811 E Javelina Ave is a home located in Maricopa County with nearby schools including Pioneer Elementary School, Greenfield Junior High School, and Montessori Education Centre Charter School.
Ownership History
Date
Name
Owned For
Owner Type
Purchase Details
Closed on
Mar 15, 2012
Sold by
Smith William F and Smith Mary R
Bought by
Smith Family Living Trust
Current Estimated Value
Home Financials for this Owner
Home Financials are based on the most recent Mortgage that was taken out on this home.
Original Mortgage
$62,400
Interest Rate
3.84%
Mortgage Type
New Conventional
Purchase Details
Closed on
Jun 16, 2008
Sold by
Smith William F and Smith Mary R
Bought by
Smith William F and Smith Mary R
Purchase Details
Closed on
Apr 29, 1996
Sold by
Mcconnell Aaron Lee and Mcconnell Ivory L
Bought by
Smith William F and Smith Mary R
Home Financials for this Owner
Home Financials are based on the most recent Mortgage that was taken out on this home.
Original Mortgage
$72,495
Interest Rate
8.07%
Mortgage Type
FHA
Create a Home Valuation Report for This Property
The Home Valuation Report is an in-depth analysis detailing your home's value as well as a comparison with similar homes in the area
Home Values in the Area
Average Home Value in this Area
Purchase History
| Date | Buyer | Sale Price | Title Company |
|---|---|---|---|
| Smith Family Living Trust | -- | Sterling Title | |
| Smith William F | -- | Accommodation | |
| Smith William F | -- | Sterling Title Agency Llc | |
| Smith William F | -- | None Available | |
| Smith William F | -- | None Available | |
| Smith William F | $73,000 | United Title Agency |
Source: Public Records
Mortgage History
| Date | Status | Borrower | Loan Amount |
|---|---|---|---|
| Previous Owner | Smith William F | $62,400 | |
| Previous Owner | Smith William F | $72,495 |
Source: Public Records
Tax History
| Year | Tax Paid | Tax Assessment Tax Assessment Total Assessment is a certain percentage of the fair market value that is determined by local assessors to be the total taxable value of land and additions on the property. | Land | Improvement |
|---|---|---|---|---|
| 2025 | $1,331 | $17,999 | -- | -- |
| 2024 | $1,292 | $17,141 | -- | -- |
| 2023 | $1,292 | $30,760 | $6,150 | $24,610 |
| 2022 | $1,261 | $22,480 | $4,490 | $17,990 |
| 2021 | $1,365 | $21,460 | $4,290 | $17,170 |
| 2020 | $826 | $16,730 | $3,340 | $13,390 |
| 2019 | $765 | $14,020 | $2,800 | $11,220 |
| 2018 | $728 | $11,830 | $2,360 | $9,470 |
| 2017 | $706 | $10,660 | $2,130 | $8,530 |
| 2016 | $732 | $9,770 | $1,950 | $7,820 |
| 2015 | $671 | $9,210 | $1,840 | $7,370 |
Source: Public Records
Map
Nearby Homes
- 2859 E Impala Ave
- 1806 S Los Alamos
- 1764 S Glenview
- 640 E Melody Dr
- 1201 E Sea Gull Dr
- 1128 E Desert Ct
- 3154 E Inverness Ave
- 3152 E Irwin Ave
- 2601 E Hopi Ave
- 3263 E Inverness Ave
- 1425 S Lindsay Rd Unit 59
- 1026 N Heritage St
- 2639 E Harmony Ave
- 1310 N Mission Cove Ln
- 450 E Merrill Ave
- 510 E Houston Ave
- 1349 E Catamaran Dr
- 1034 E Encinas Ave
- 721 E San Pedro Ave Unit 5
- 1502 E Treasure Cove Dr
- 2803 E Javelina Ave
- 2823 E Javelina Ave Unit 4
- 2812 E Javelina Ave
- 2804 E Javelina Ave
- 2835 E Javelina Ave
- 850 W Baseline Rd
- 2824 E Javelina Ave
- 2845 E Javelina Ave
- 3333 S Mesa Assisted Living St
- 1931 S Fontana
- 2850 E Baseline Rd
- 2850 E Baseline Rd
- 2850 E Baseline Rd
- 2850 E Baseline Rd
- 2850 E Baseline Rd
- 2850 E Baseline Rd
- 2850 E Baseline Rd
- 2850 E Baseline Rd
- 2850 E Baseline Rd
- 2850 E Baseline Rd
Your Personal Tour Guide
Ask me questions while you tour the home.