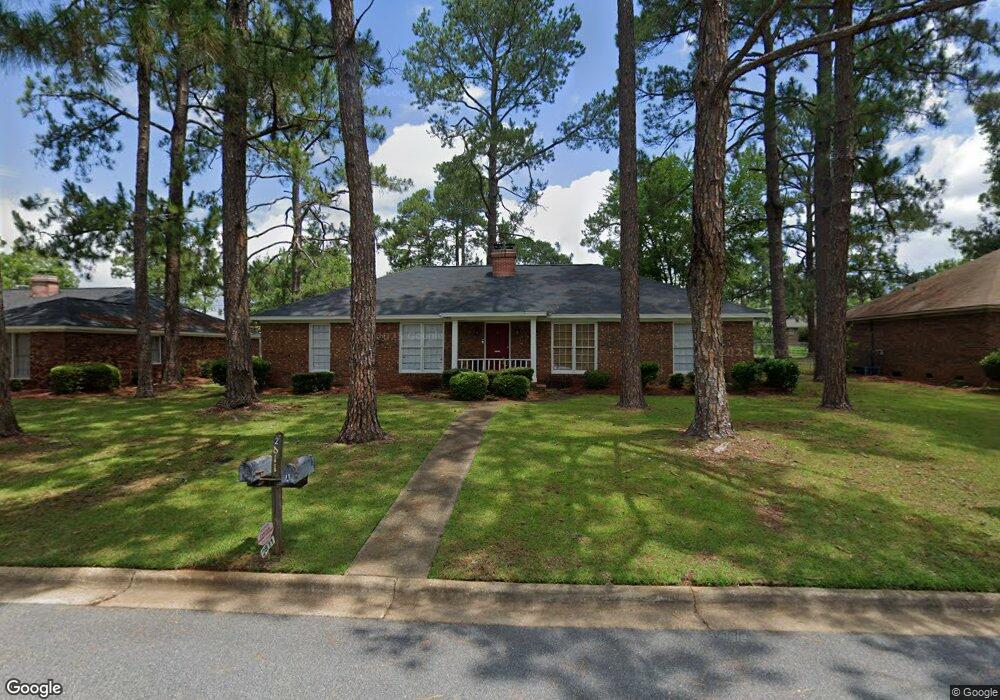
2811 Falcon Ln Albany, GA 31721
Westwood NeighborhoodEstimated Value: $166,000 - $210,000
6
Beds
4
Baths
2,462
Sq Ft
$77/Sq Ft
Est. Value
About This Home
This home is located at 2811 Falcon Ln, Albany, GA 31721 and is currently estimated at $188,722, approximately $76 per square foot. 2811 Falcon Ln is a home located in Dougherty County with nearby schools including Lake Park Elementary School, Merry Acres Middle School, and Westover High School.
Ownership History
Date
Name
Owned For
Owner Type
Purchase Details
Closed on
Jun 9, 2011
Sold by
Fussell-Tison Ltd Partnership
Bought by
Fussell & Rouse Properties Llc
Current Estimated Value
Purchase Details
Closed on
Nov 20, 2007
Sold by
Fussell Charles Hugh
Bought by
Fussell-Tison Ltd Partnership
Purchase Details
Closed on
Dec 9, 2005
Sold by
Suntrust Trustee
Bought by
Fussell Charles Hugh
Home Financials for this Owner
Home Financials are based on the most recent Mortgage that was taken out on this home.
Original Mortgage
$97,840
Interest Rate
6.29%
Mortgage Type
New Conventional
Purchase Details
Closed on
Jul 1, 2005
Sold by
Suntrust Bank As Trustee
Bought by
Suntrust Bank As Trustee
Purchase Details
Closed on
Sep 30, 2000
Sold by
Hall James B
Bought by
Hall James B Revocable Family Trust
Purchase Details
Closed on
Dec 8, 1976
Sold by
Merry Acres Rentals
Bought by
Hall James B
Create a Home Valuation Report for This Property
The Home Valuation Report is an in-depth analysis detailing your home's value as well as a comparison with similar homes in the area
Home Values in the Area
Average Home Value in this Area
Purchase History
| Date | Buyer | Sale Price | Title Company |
|---|---|---|---|
| Fussell & Rouse Properties Llc | -- | -- | |
| Fussell-Tison Ltd Partnership | -- | -- | |
| Fussell Charles Hugh | $122,300 | -- | |
| Suntrust Bank As Trustee | -- | -- | |
| Hall James B Revocable Family Trust | -- | -- | |
| Hall James B | -- | -- |
Source: Public Records
Mortgage History
| Date | Status | Borrower | Loan Amount |
|---|---|---|---|
| Previous Owner | Fussell Charles Hugh | $97,840 |
Source: Public Records
Tax History Compared to Growth
Tax History
| Year | Tax Paid | Tax Assessment Tax Assessment Total Assessment is a certain percentage of the fair market value that is determined by local assessors to be the total taxable value of land and additions on the property. | Land | Improvement |
|---|---|---|---|---|
| 2024 | $2,216 | $46,440 | $7,800 | $38,640 |
| 2023 | $2,164 | $46,440 | $7,800 | $38,640 |
| 2022 | $2,172 | $46,440 | $7,800 | $38,640 |
| 2021 | $2,013 | $46,440 | $7,800 | $38,640 |
| 2020 | $2,018 | $46,440 | $7,800 | $38,640 |
| 2019 | $2,026 | $46,440 | $7,800 | $38,640 |
| 2018 | $0 | $46,440 | $7,800 | $38,640 |
| 2017 | $1,611 | $46,440 | $7,800 | $38,640 |
| 2016 | $1,896 | $46,440 | $7,800 | $38,640 |
| 2015 | $1,901 | $46,440 | $7,800 | $38,640 |
| 2014 | $1,878 | $46,440 | $7,800 | $38,640 |
Source: Public Records
Map
Nearby Homes
- 2814 Reeves Ln
- 1506 Westwood Dr
- 1800 Regalwood Dr
- 2613 Partridge Dr
- 2807 Stonewater Dr
- 3108 Cane Mill Ct
- 2802 Stonewater Dr
- 1627 Devon Dr
- 120 Mossydale Ln
- 2203 Hanover St
- 3013 Ember Ct
- 2813 Capers Ln
- 2508 Pheasant Dr
- 1903 Devon Dr
- 1720 Whisperwood St
- 3005 Stonewater Dr
- 1603 Northwood Dr
- 415 Forest Glen Dr
- 2506 Ridgewood Ln
- 2303 Pineridge Ln
- 2809 Falcon Ln
- 2813 Falcon Ln
- 2812 Reeves Ln
- 2815 Falcon Ln
- 2807 Falcon Ln
- 2810 Reeves Ln
- 2808 Falcon Ln
- 2812 Falcon Ln
- 2808 Reeves Ln
- 2808 Lane Reeves Ln
- 2810 Falcon Ln
- 2816 Reeves Ln
- 2814 Falcon Ln
- 2805 Falcon Ln
- 2817 Falcon Ln
- 2806 Falcon Ln
- 2806 Reeves Ln
- 2818 Reeves Ln
- 2816 Falcon Ln
- 2804 Falcon Ln