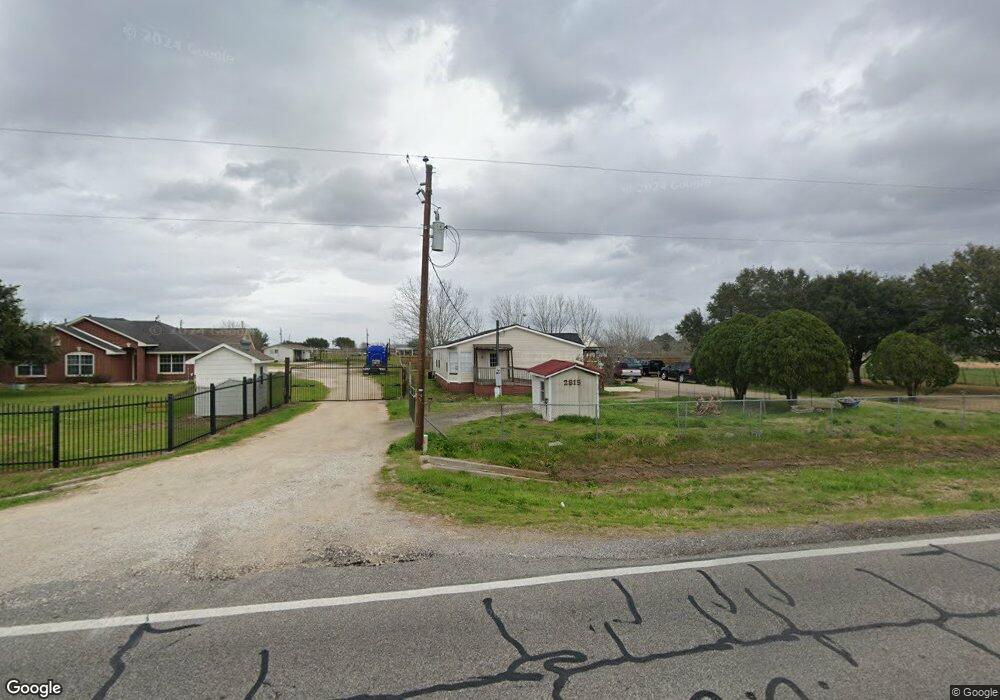
2811 Fm 360 Rd Rosenberg, TX 77471
Estimated Value: $291,856 - $369,000
3
Beds
2
Baths
1,957
Sq Ft
$176/Sq Ft
Est. Value
About This Home
This home is located at 2811 Fm 360 Rd, Rosenberg, TX 77471 and is currently estimated at $343,714, approximately $175 per square foot. 2811 Fm 360 Rd is a home located in Fort Bend County with nearby schools including Needville Elementary School, Needville Junior High School, and Needville Middle School.
Create a Home Valuation Report for This Property
The Home Valuation Report is an in-depth analysis detailing your home's value as well as a comparison with similar homes in the area
Home Values in the Area
Average Home Value in this Area
Tax History Compared to Growth
Tax History
| Year | Tax Paid | Tax Assessment Tax Assessment Total Assessment is a certain percentage of the fair market value that is determined by local assessors to be the total taxable value of land and additions on the property. | Land | Improvement |
|---|---|---|---|---|
| 2025 | $910 | $248,299 | $58,016 | $194,842 |
| 2024 | $910 | $225,726 | $31,824 | $193,902 |
| 2023 | $796 | $205,205 | $6,246 | $198,959 |
| 2022 | $2,138 | $186,550 | $8,050 | $178,500 |
| 2021 | $3,385 | $169,590 | $46,010 | $123,580 |
| 2020 | $3,271 | $154,170 | $46,010 | $108,160 |
| 2019 | $3,149 | $140,150 | $13,670 | $126,480 |
| 2018 | $2,987 | $133,070 | $13,670 | $119,400 |
| 2017 | $2,828 | $131,450 | $13,670 | $117,780 |
| 2016 | $2,831 | $131,610 | $13,670 | $117,940 |
| 2015 | $2,434 | $135,150 | $13,670 | $121,480 |
| 2014 | $2,575 | $132,620 | $13,670 | $118,950 |
Source: Public Records
Map
Nearby Homes
- 2301 Fm 360 Rd
- 2021 Fm 360 Rd
- 3415 Fm 360 Rd
- 0 Fm 360 Rd
- 412 Fm 360 Rd
- 9503 Cardinal Rd
- 0 Modena School Rd
- 4021 Baker Rd
- 7937 Welch Rd
- 7702 Vincik Ehlert Rd
- 2407 Thuesen Rd
- 7802 Brinkmeyer Rd
- 4622 Hill Side Ln
- 10410 Birds Nest Dr
- 10407 Rocky Trail
- 10630 Brinkmeyer Rd
- 10414 Birds Nest Dr
- 10402 Rocky Trail
- 10406 Rocky Trail
- 10418 Birds Nest Dr
- 2815 Fm 360 Rd
- 8959 Lucky Ln
- 2623 Fm 360 Rd
- 2609 Fm 360 Rd
- 8925 Lucky Ln
- 2529 Fm 360 Rd
- 2829 Fm 360 Rd
- 2521 Fm 360 Rd
- 2830 Fm 360 Rd
- 2513 Fm 360 Rd
- 2921 Fm 360 Rd
- 2810 Bull Run St
- 2930 Fm 360 Rd
- 2931 Fm 360 Rd
- 2528 Bull Run St
- 8811 Blase Rd
- 2659 Bull Run St
- 2731 Bull Run St
- 2609 Bull Run St
- 8803 Blase Rd