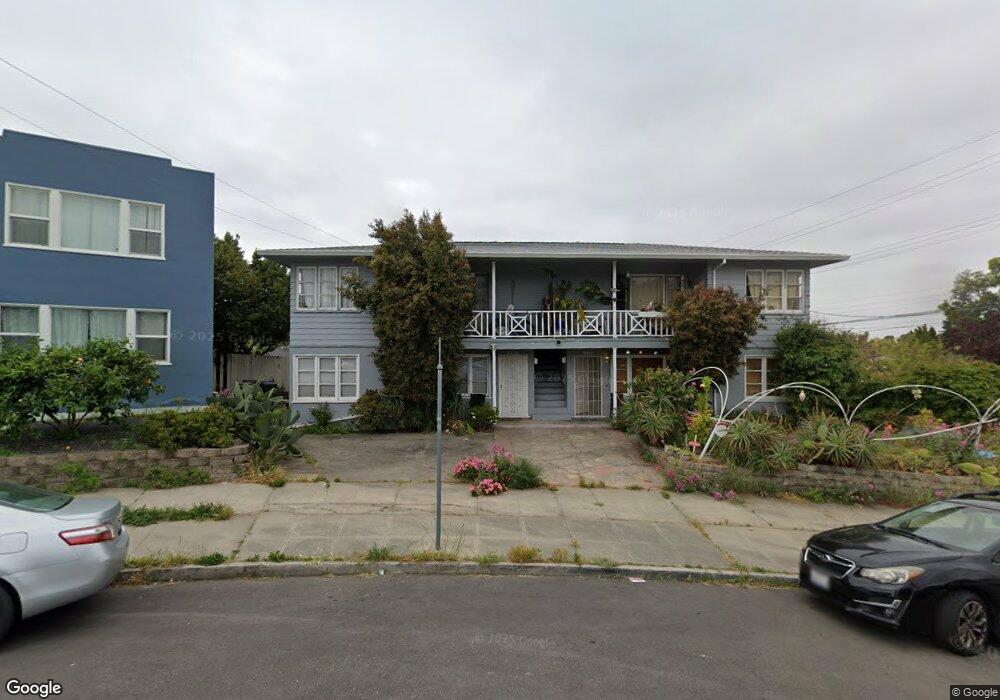
2811 Georgia St Oakland, CA 94602
Dimond District NeighborhoodEstimated Value: $860,000 - $1,505,359
4
Beds
4
Baths
2,768
Sq Ft
$394/Sq Ft
Est. Value
About This Home
This home is located at 2811 Georgia St, Oakland, CA 94602 and is currently estimated at $1,091,340, approximately $394 per square foot. 2811 Georgia St is a home located in Alameda County with nearby schools including Fruitvale Elementary School, Bret Harte Middle School, and Skyline High School.
Ownership History
Date
Name
Owned For
Owner Type
Purchase Details
Closed on
Sep 26, 2005
Sold by
Ordaz Jose De Jesus
Bought by
The Jose De Jesus Ordaz Living Trust
Current Estimated Value
Purchase Details
Closed on
Feb 20, 2002
Sold by
Jones Stephen and Jones Wendy
Bought by
Ordaz Jose Dejesus
Home Financials for this Owner
Home Financials are based on the most recent Mortgage that was taken out on this home.
Original Mortgage
$400,000
Outstanding Balance
$162,821
Interest Rate
6.84%
Estimated Equity
$928,519
Purchase Details
Closed on
Jul 21, 1999
Sold by
Poon Clifford & Shirley Trs and Steven Y
Bought by
Jones Stephen and Jones Wendy
Home Financials for this Owner
Home Financials are based on the most recent Mortgage that was taken out on this home.
Original Mortgage
$238,000
Interest Rate
7.51%
Purchase Details
Closed on
Apr 11, 1999
Sold by
Hong Helen Choy and Hong Helen C
Bought by
Choy Hong Richard Ld and Choy Hong Helen
Purchase Details
Closed on
Apr 24, 1996
Sold by
Quan Lillian M
Bought by
Quan Steven Y and Quan Lillian M
Create a Home Valuation Report for This Property
The Home Valuation Report is an in-depth analysis detailing your home's value as well as a comparison with similar homes in the area
Home Values in the Area
Average Home Value in this Area
Purchase History
We collect this data history from publicly available records. To have your information removed, we recommend requesting removal directly through your county’s website.
| Date | Buyer | Sale Price | Title Company |
|---|---|---|---|
| The Jose De Jesus Ordaz Living Trust | -- | -- | |
| Ordaz Jose Dejesus | $500,000 | American Title Co | |
| Jones Stephen | $280,000 | Fidelity National Title Co | |
| Choy Hong Richard Ld | -- | -- | |
| Quan Steven Y | -- | -- |
Source: Public Records
Mortgage History
We collect this data history from publicly available records. To have your information removed, we recommend requesting removal directly through your county’s website.
| Date | Status | Borrower | Loan Amount |
|---|---|---|---|
| Open | Ordaz Jose Dejesus | $400,000 | |
| Previous Owner | Jones Stephen | $238,000 | |
| Closed | Ordaz Jose Dejesus | $50,000 |
Source: Public Records
Tax History
| Year | Tax Paid | Tax Assessment Tax Assessment Total Assessment is a certain percentage of the fair market value that is determined by local assessors to be the total taxable value of land and additions on the property. | Land | Improvement |
|---|---|---|---|---|
| 2025 | $12,952 | $731,600 | $221,580 | $517,020 |
| 2024 | $12,952 | $717,120 | $217,236 | $506,884 |
| 2023 | $13,525 | $709,924 | $212,977 | $496,947 |
| 2022 | $12,937 | $696,004 | $208,801 | $487,203 |
| 2021 | $12,047 | $682,360 | $204,708 | $477,652 |
| 2020 | $11,904 | $675,364 | $202,609 | $472,755 |
| 2019 | $11,244 | $662,124 | $198,637 | $463,487 |
| 2018 | $11,004 | $649,144 | $194,743 | $454,401 |
| 2017 | $10,483 | $636,420 | $190,926 | $445,494 |
| 2016 | $10,167 | $623,944 | $187,183 | $436,761 |
| 2015 | $10,108 | $614,574 | $184,372 | $430,202 |
| 2014 | $8,632 | $475,000 | $142,500 | $332,500 |
Source: Public Records
Map
Nearby Homes
- 2734 Macarthur Blvd
- 2818 Macarthur Blvd
- 2600 Macarthur Blvd
- 2901 Macarthur Blvd Unit 103
- 2596 Macarthur Blvd
- 2550 Damuth St
- 3431 Wilson Ave
- 3114 Suter St
- 2701 Madeline St
- 2508 Damuth St
- 3558 Maple Ave
- 3477 Boston Ave Unit 4
- 3156 Texas St
- 3687 Maple Ave Unit 9
- 3019 Florida St
- 2450 Palmetto St Unit 4
- 3039 Kansas St
- 2417 Palmetto St
- 3601 Lincoln Ave
- 3137 Pleitner Ave
- 3458 Coolidge Ave
- 2833 Georgia St
- 3452 Coolidge Ave
- 2784 Georgia St
- 2835 Georgia St
- 3469 Coolidge Ave
- 3463 Coolidge Ave
- 3440 Coolidge Ave
- 3457 Coolidge Ave
- 2808 Delaware St
- 2816 Delaware St
- 3451 Coolidge Ave
- 2830 Delaware St
- 2800 Delaware St
- 2843 Georgia St
- 2836 Delaware St
- 3445 Coolidge Ave
- 2888 Georgia St
- 2715 Macarthur Blvd Unit ID1305026P
- 2842 Delaware St
Your Personal Tour Guide
Ask me questions while you tour the home.