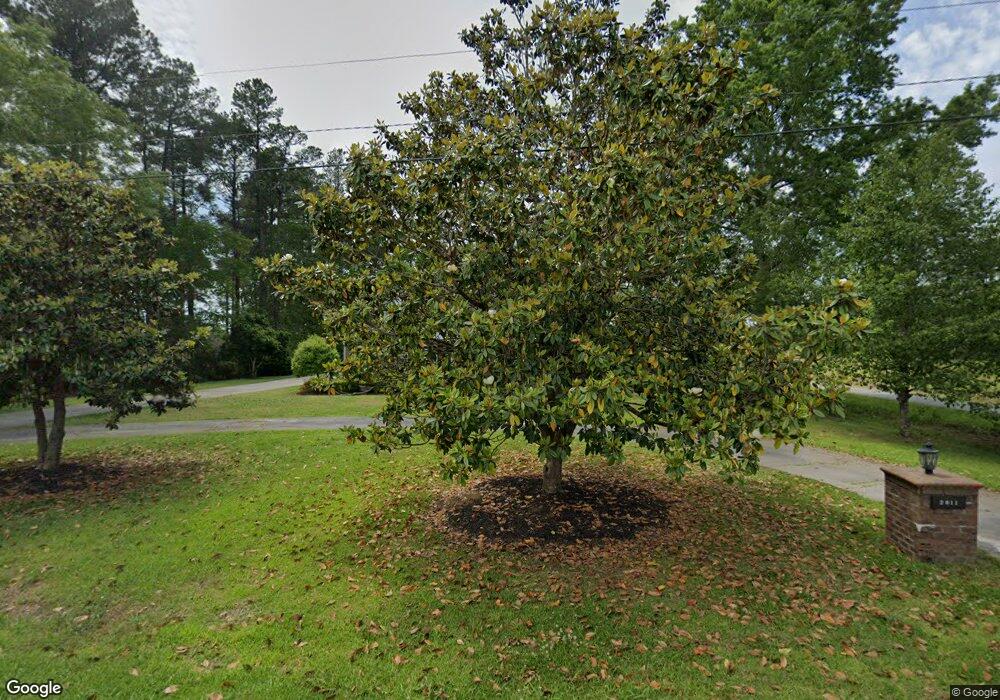
2811 Graham Rd Conway, SC 29526
Estimated Value: $463,000 - $620,000
3
Beds
3
Baths
3,252
Sq Ft
$156/Sq Ft
Est. Value
About This Home
This home is located at 2811 Graham Rd, Conway, SC 29526 and is currently estimated at $508,572, approximately $156 per square foot. 2811 Graham Rd is a home located in Horry County with nearby schools including Homewood Elementary School, Whittemore Park Middle School, and Conway High School.
Ownership History
Date
Name
Owned For
Owner Type
Purchase Details
Closed on
Jan 22, 2021
Sold by
Asmonga Daniel A
Bought by
Asmonga Daniel A
Current Estimated Value
Home Financials for this Owner
Home Financials are based on the most recent Mortgage that was taken out on this home.
Original Mortgage
$320,000
Interest Rate
2.6%
Mortgage Type
New Conventional
Purchase Details
Closed on
Jun 9, 2014
Sold by
Asmonga Daniel A
Bought by
Asmonnga Daniel A and Asmonga Paula Michele
Purchase Details
Closed on
Oct 22, 2007
Sold by
Cannon James L and Cannon Fedora T
Bought by
Asmonga Daniel A
Home Financials for this Owner
Home Financials are based on the most recent Mortgage that was taken out on this home.
Original Mortgage
$456,000
Interest Rate
6.27%
Mortgage Type
Purchase Money Mortgage
Purchase Details
Closed on
Sep 14, 2005
Sold by
Cannon James L and Cannon Fedora T
Bought by
Cannon James L and Cannon Fedora T
Create a Home Valuation Report for This Property
The Home Valuation Report is an in-depth analysis detailing your home's value as well as a comparison with similar homes in the area
Home Values in the Area
Average Home Value in this Area
Purchase History
| Date | Buyer | Sale Price | Title Company |
|---|---|---|---|
| Asmonga Daniel A | -- | -- | |
| Asmonnga Daniel A | -- | -- | |
| Asmonga Daniel A | $456,000 | None Available | |
| Cannon James L | -- | -- |
Source: Public Records
Mortgage History
| Date | Status | Borrower | Loan Amount |
|---|---|---|---|
| Previous Owner | Asmonga Daniel A | $320,000 | |
| Previous Owner | Asmonga Daniel A | $456,000 |
Source: Public Records
Tax History Compared to Growth
Tax History
| Year | Tax Paid | Tax Assessment Tax Assessment Total Assessment is a certain percentage of the fair market value that is determined by local assessors to be the total taxable value of land and additions on the property. | Land | Improvement |
|---|---|---|---|---|
| 2024 | $1,187 | $14,890 | $4,142 | $10,748 |
| 2023 | $1,166 | $8,182 | $1,210 | $6,972 |
| 2021 | $5,940 | $8,182 | $1,210 | $6,972 |
| 2020 | $1,118 | $8,182 | $1,210 | $6,972 |
| 2019 | $1,118 | $8,182 | $1,210 | $6,972 |
| 2018 | $1,069 | $7,382 | $1,210 | $6,172 |
| 2017 | $1,069 | $7,382 | $1,210 | $6,172 |
| 2016 | -- | $7,382 | $1,210 | $6,172 |
| 2015 | $1,069 | $7,382 | $1,210 | $6,172 |
| 2014 | $1,015 | $7,382 | $1,210 | $6,172 |
Source: Public Records
Map
Nearby Homes
- 2807 Graham Rd
- 124 Windmeadows Dr
- 236 Spencerswood Dr
- 416 Greenwich Dr
- 213 Country Club Dr
- 2593 Long Avenue Extension
- 300 Crescent Dr
- 2832 Long Avenue Extension
- 605 Ivy Glen Dr
- 609 Ivy Glen Dr
- 2532 Dargan Cir
- 2705 Ivy Glen Dr
- 2108 Cultra Rd
- 1.25 Acs Long Avenue Extension
- 2424 Main St
- 2889 Riverboat Way
- 1509 Lakeland Dr
- 3173 Long Avenue Extension
- 2843 Riverboat Way
- 2419 Blake St
- 2807 Graham Rd
- 2816 Graham Rd
- 2812 Graham Rd
- 2820 Graham Rd
- 2820 Graham Rd Unit Country Club Conway
- 2808 Graham Rd
- 2824 Graham Rd
- 105 Windmeadows Dr
- 215 Buchanan Ln
- 104 Windmeadows Dr
- 2828 Graham Rd
- 168 Windmeadows Dr
- 2804 Graham Rd
- 164 Windmeadows Dr
- 108 Windmeadows Dr
- 2830 Graham Rd
- TBD Graham Rd
- 2.12 acres Graham Rd
- 120 Ben St
- 160 Windmeadows Dr