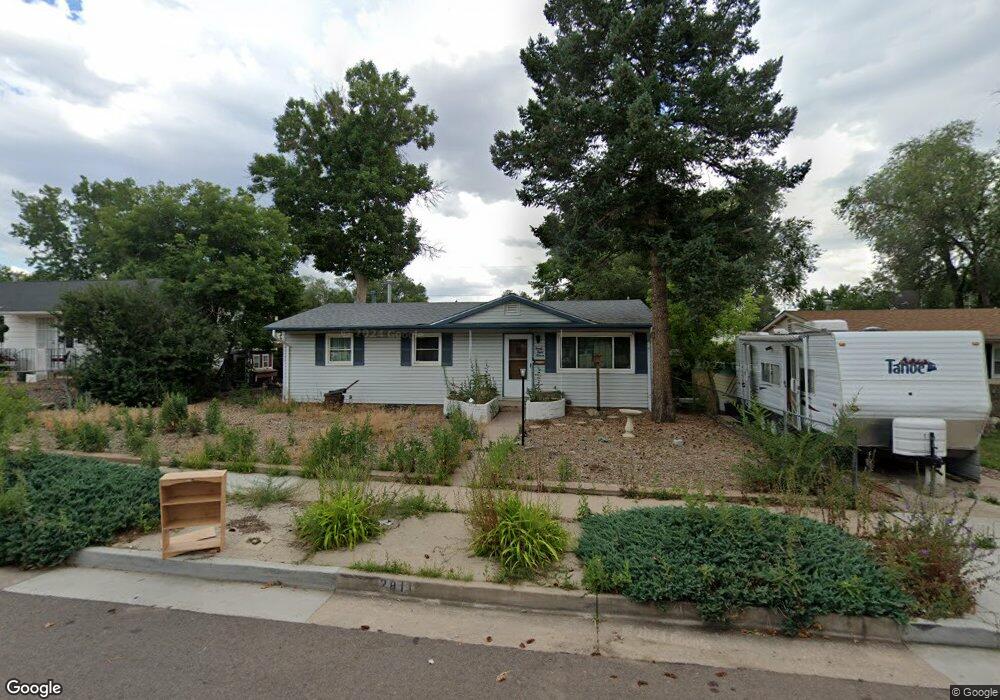
2811 Merry Ln Colorado Springs, CO 80909
Austin Estates NeighborhoodEstimated Value: $325,000 - $357,000
3
Beds
1
Bath
1,226
Sq Ft
$283/Sq Ft
Est. Value
About This Home
This home is located at 2811 Merry Ln, Colorado Springs, CO 80909 and is currently estimated at $347,451, approximately $283 per square foot. 2811 Merry Ln is a home located in El Paso County with nearby schools including Twain Elementary School, Galileo School Of Math And Science, and Mitchell High School.
Ownership History
Date
Name
Owned For
Owner Type
Purchase Details
Closed on
Oct 22, 2021
Sold by
Sperry Paula
Bought by
Groener Garrett M
Current Estimated Value
Home Financials for this Owner
Home Financials are based on the most recent Mortgage that was taken out on this home.
Original Mortgage
$327,360
Outstanding Balance
$298,522
Interest Rate
2.8%
Mortgage Type
VA
Estimated Equity
$48,929
Purchase Details
Closed on
May 29, 2015
Sold by
Hughes Shellie L
Bought by
Sperry Paula L
Home Financials for this Owner
Home Financials are based on the most recent Mortgage that was taken out on this home.
Original Mortgage
$152,192
Interest Rate
3.75%
Mortgage Type
FHA
Purchase Details
Closed on
Jul 17, 2014
Sold by
Foland Roy C
Bought by
Hughes Shellie L
Home Financials for this Owner
Home Financials are based on the most recent Mortgage that was taken out on this home.
Original Mortgage
$115,920
Interest Rate
4.17%
Mortgage Type
New Conventional
Create a Home Valuation Report for This Property
The Home Valuation Report is an in-depth analysis detailing your home's value as well as a comparison with similar homes in the area
Home Values in the Area
Average Home Value in this Area
Purchase History
| Date | Buyer | Sale Price | Title Company |
|---|---|---|---|
| Groener Garrett M | $320,000 | First American Title | |
| Sperry Paula L | $155,000 | Land Title Guarantee Company | |
| Hughes Shellie L | $144,900 | Land Title Guarantee Company |
Source: Public Records
Mortgage History
| Date | Status | Borrower | Loan Amount |
|---|---|---|---|
| Open | Groener Garrett M | $327,360 | |
| Previous Owner | Sperry Paula L | $152,192 | |
| Previous Owner | Hughes Shellie L | $115,920 |
Source: Public Records
Tax History Compared to Growth
Tax History
| Year | Tax Paid | Tax Assessment Tax Assessment Total Assessment is a certain percentage of the fair market value that is determined by local assessors to be the total taxable value of land and additions on the property. | Land | Improvement |
|---|---|---|---|---|
| 2025 | $1,104 | $24,000 | -- | -- |
| 2024 | $993 | $24,260 | $3,840 | $20,420 |
| 2022 | $1,009 | $18,030 | $2,780 | $15,250 |
| 2021 | $1,094 | $18,540 | $2,860 | $15,680 |
| 2020 | $1,082 | $15,940 | $2,500 | $13,440 |
| 2019 | $1,076 | $15,940 | $2,500 | $13,440 |
| 2018 | $934 | $12,730 | $1,870 | $10,860 |
| 2017 | $885 | $12,730 | $1,870 | $10,860 |
| 2016 | $705 | $12,160 | $1,830 | $10,330 |
| 2015 | $702 | $12,160 | $1,830 | $10,330 |
| 2014 | $336 | $11,160 | $1,830 | $9,330 |
Source: Public Records
Map
Nearby Homes
- 1523 Happiness Dr
- 1701 Grant Ave
- 1505 Bates Dr
- 1361 Edith Ln
- 1908 Winston Rd
- 3118 E La Salle St
- 1346 Bates Dr
- 1505 Holmes Dr
- 1729 Happiness Dr
- 1463 Wilks Place
- 1927 Downing Dr
- 1333 Holmes Dr
- 1429 Laurette Dr
- 1909 Trent Ave
- 3118 E San Miguel St
- 1726 Kingsley Dr
- 1226 Holmes Dr
- 2523 E La Salle St
- 1227 Holmes Dr
- 2035 Downing Dr
- 2809 Merry Ln
- 2821 Merry Ln
- 2825 Merry Ln
- 1540 Happiness Dr
- 1546 Happiness Dr
- 1538 Happiness Dr
- 2818 Merry Ln
- 2812 Merry Ln
- 2822 Merry Ln
- 2804 Merry Ln
- 2829 Merry Ln
- 1550 Happiness Dr
- 1619 N Circle Dr
- 2826 Merry Ln
- 1554 Happiness Dr
- 1617 N Circle Dr
- 2835 Merry Ln
- 1532 Happiness Dr
- 2830 Merry Ln
- 1805 Alpine Dr