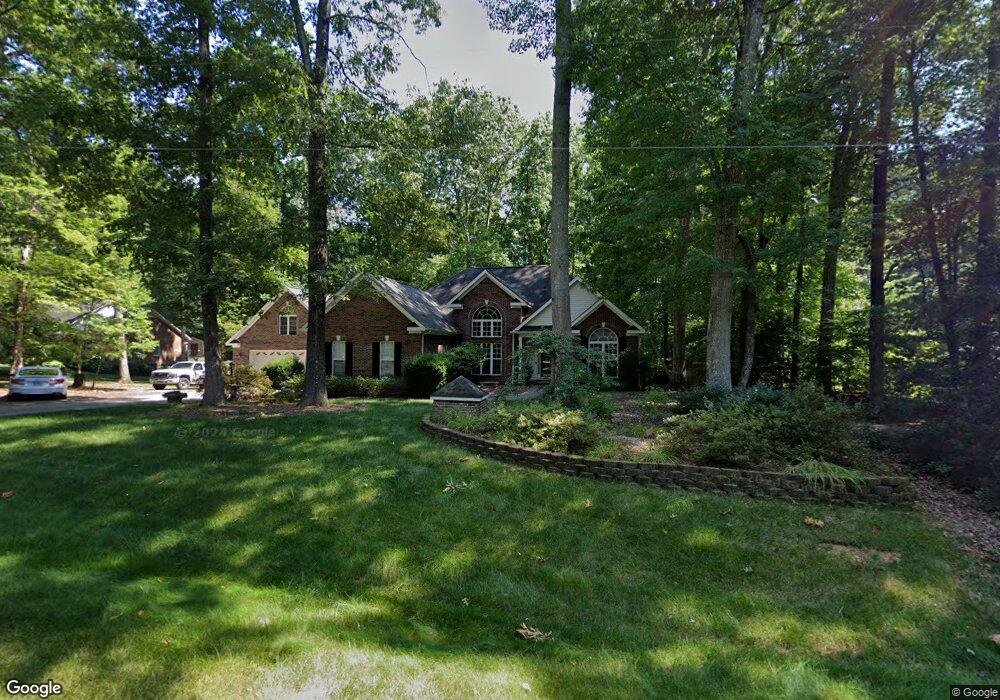
2811 Oak Hollow Dr Asheboro, NC 27205
Estimated Value: $361,297 - $381,000
--
Bed
2
Baths
1,706
Sq Ft
$220/Sq Ft
Est. Value
About This Home
This home is located at 2811 Oak Hollow Dr, Asheboro, NC 27205 and is currently estimated at $374,824, approximately $219 per square foot. 2811 Oak Hollow Dr is a home located in Randolph County with nearby schools including Sycamore Elementary School, Farmer Elementary School, and Uwharrie Ridge Six-Twelve.
Ownership History
Date
Name
Owned For
Owner Type
Purchase Details
Closed on
Dec 13, 2004
Sold by
Rogers Thomas and Rogers Pamela
Bought by
York Todd M and York Kelly B
Current Estimated Value
Home Financials for this Owner
Home Financials are based on the most recent Mortgage that was taken out on this home.
Original Mortgage
$150,000
Outstanding Balance
$73,805
Interest Rate
5.57%
Mortgage Type
Purchase Money Mortgage
Estimated Equity
$301,019
Purchase Details
Closed on
Apr 26, 2004
Sold by
Covington Joseph Edward and Covington Steven Hunter
Bought by
Rogers Thomas
Purchase Details
Closed on
Mar 5, 2002
Bought by
York Todd M York Kelly B
Purchase Details
Closed on
Sep 3, 1998
Bought by
York Todd M York Kelly B
Purchase Details
Closed on
May 24, 1991
Bought by
York Todd M York Kelly B
Create a Home Valuation Report for This Property
The Home Valuation Report is an in-depth analysis detailing your home's value as well as a comparison with similar homes in the area
Home Values in the Area
Average Home Value in this Area
Purchase History
| Date | Buyer | Sale Price | Title Company |
|---|---|---|---|
| York Todd M | $192,500 | -- | |
| Rogers Thomas | $25,000 | -- | |
| York Todd M York Kelly B | $22,000 | -- | |
| York Todd M York Kelly B | $17,000 | -- | |
| York Todd M York Kelly B | $10,000 | -- |
Source: Public Records
Mortgage History
| Date | Status | Borrower | Loan Amount |
|---|---|---|---|
| Open | York Todd M | $150,000 | |
| Closed | York Todd M | $23,000 |
Source: Public Records
Tax History Compared to Growth
Tax History
| Year | Tax Paid | Tax Assessment Tax Assessment Total Assessment is a certain percentage of the fair market value that is determined by local assessors to be the total taxable value of land and additions on the property. | Land | Improvement |
|---|---|---|---|---|
| 2025 | $2,155 | $326,570 | $48,500 | $278,070 |
| 2024 | $2,123 | $326,570 | $48,500 | $278,070 |
| 2023 | $2,123 | $326,570 | $48,500 | $278,070 |
| 2022 | $1,854 | $236,910 | $38,800 | $198,110 |
| 2021 | $1,854 | $236,910 | $38,800 | $198,110 |
| 2020 | $1,807 | $236,910 | $38,800 | $198,110 |
| 2019 | $1,807 | $236,910 | $38,800 | $198,110 |
| 2018 | $1,598 | $204,240 | $24,780 | $179,460 |
| 2016 | $1,578 | $204,243 | $24,780 | $179,463 |
| 2015 | $1,562 | $204,243 | $24,780 | $179,463 |
| 2014 | -- | $204,243 | $24,780 | $179,463 |
Source: Public Records
Map
Nearby Homes
- 1746 Taylors Creek Dr
- 2442 Farmwood Ln
- 1559 Allen Ct
- 0 Tot Hill Farm Rd
- 2318 Doul Mountain Rd
- 2272 Doul Mountain Rd
- 0 Nc Highway 49 S Unit 1162269
- 0 Deer Ridge Rd Unit 1190677
- 0 Deer Ridge Rd Unit 1191444
- 2579 Grey Rabbit Run
- 3526 Tot Hill Farm Rd
- 2634 Fox Ridge Rd
- 2626 Fox Ridge Rd
- 0 Fox Ridge Rd Unit 1197775
- Lot 37 Fox Ridge Rd
- Lot 12 Johns Ridge Dr
- Lot 13 Johns Ridge Dr
- 2613 High Meadow Dr
- 2565 High Meadow Dr
- 001 High Meadow Dr
- 2805 Oak Hollow Dr
- 2827 Oak Hollow Dr
- 1988 Taylors Creek Dr
- 2717 Oak Hollow Dr
- 2839 Oak Hollow Dr
- 2709 Oak Hollow Dr
- 3008 Nc Highway 49 S
- 3010 Nc Highway 49 S
- 1974 Taylors Creek Dr
- 3026 Nc Highway 49 S
- 2842 Oak Hollow Dr
- 3044 Nc Highway 49 S
- 1975 Taylors Creek Dr
- 2848 Oak Hollow Dr
- 2693 Oak Hollow Dr
- 2704 Oak Hollow Dr
- 1959 Taylors Creek Dr
- 3062 Nc Highway 49 S
- 2717 Shaw St
- 2731 Shaw St