Estimated Value: $288,245 - $356,000
3
Beds
2
Baths
2,113
Sq Ft
$154/Sq Ft
Est. Value
About This Home
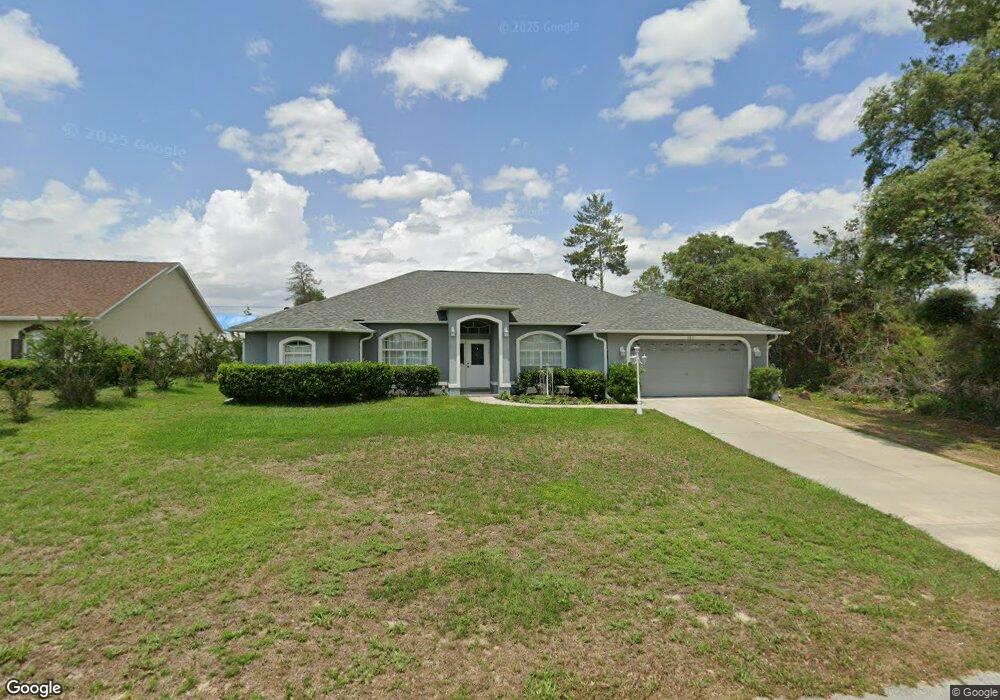
This home is located at 2811 SW 142nd Ln, Ocala, FL 34473 and is currently estimated at $325,061, approximately $153 per square foot. 2811 SW 142nd Ln is a home located in Marion County with nearby schools including Marion Oaks Elementary School, Horizon Academy At Marion Oaks, and Dunnellon High School.
Ownership History
Date
Name
Owned For
Owner Type
Purchase Details
Closed on
Apr 28, 2021
Sold by
Allonce Jean Sem and Allonce Leonie P
Bought by
Pabon Rivera Felix Joel and Rodas Medero Ileana
Current Estimated Value
Home Financials for this Owner
Home Financials are based on the most recent Mortgage that was taken out on this home.
Original Mortgage
$7,009
Outstanding Balance
$3,996
Interest Rate
2.31%
Mortgage Type
New Conventional
Estimated Equity
$321,065
Purchase Details
Closed on
Dec 15, 2003
Sold by
Marco Polo Builders Inc
Bought by
Allonce Jean Sem and Allonce Leonie P
Home Financials for this Owner
Home Financials are based on the most recent Mortgage that was taken out on this home.
Original Mortgage
$130,000
Interest Rate
5.75%
Mortgage Type
Construction
Purchase Details
Closed on
Feb 11, 2003
Sold by
Imbrogno Enrico and Cardillo Luigi
Bought by
Marco Polo Builders Inc
Create a Home Valuation Report for This Property
The Home Valuation Report is an in-depth analysis detailing your home's value as well as a comparison with similar homes in the area
Home Values in the Area
Average Home Value in this Area
Purchase History
| Date | Buyer | Sale Price | Title Company |
|---|---|---|---|
| Pabon Rivera Felix Joel | $200,000 | Attorney | |
| Allonce Jean Sem | $10,000 | Advance Homestead Title Inc | |
| Marco Polo Builders Inc | $3,800 | Advance Homestead Title |
Source: Public Records
Mortgage History
| Date | Status | Borrower | Loan Amount |
|---|---|---|---|
| Open | Pabon Rivera Felix Joel | $7,009 | |
| Open | Pabon Rivera Felix Joel | $196,377 | |
| Previous Owner | Allonce Jean Sem | $130,000 |
Source: Public Records
Tax History
| Year | Tax Paid | Tax Assessment Tax Assessment Total Assessment is a certain percentage of the fair market value that is determined by local assessors to be the total taxable value of land and additions on the property. | Land | Improvement |
|---|---|---|---|---|
| 2025 | $4,770 | $294,324 | $36,000 | $258,324 |
| 2024 | $4,589 | $291,631 | -- | -- |
| 2023 | $5,080 | $318,859 | $0 | $0 |
| 2022 | $4,924 | $309,572 | $16,100 | $293,472 |
| 2021 | $3,699 | $196,867 | $7,200 | $189,667 |
| 2020 | $3,352 | $169,185 | $6,400 | $162,785 |
| 2019 | $3,287 | $165,766 | $5,450 | $160,316 |
| 2018 | $2,984 | $158,900 | $4,900 | $154,000 |
| 2017 | $2,724 | $140,163 | $3,800 | $136,363 |
| 2016 | $2,579 | $122,047 | $0 | $0 |
| 2015 | $2,331 | $110,952 | $0 | $0 |
| 2014 | $2,118 | $100,865 | $0 | $0 |
Source: Public Records
Map
Nearby Homes
- 14245 SW 28th Ct
- 14211 SW 32nd Terrace Rd
- 2760 SW 140th Loop
- 2955 SW 140th Loop
- 14091 SW 32nd Terrace Rd
- 2717 SW 140th Loop
- 13975 SW 27 Court Rd
- 14380 SW 33rd Court Rd
- 14322 SW 28th Ave
- 13994 SW 27th Court Rd
- 16647 SW 30th Terrace Rd
- 14422 SW 32nd Terrace Rd
- 14432 SW 32nd Terrace Rd
- 0 SW 139 St
- 16582 SW 30th Terrace Rd
- 16454 SW 30th Terrace Rd
- 2800 SW 144th Place
- 4143 SW 133rd Loop
- 13880 SW 45th Terrace
- 00 SW 144 Place
- 2831 SW 142nd Ln
- 2770 SW 143 Place Rd
- 2750 SW 143rd Place Rd
- 2790 SW 143rd Place Rd
- 2851 SW 142nd Ln
- 2776 SW 142nd Ln
- 2810 SW 142nd Ln
- 2770 SW 143rd Place Rd
- 14201 SW 28th Ct
- 2810 SW 143rd Place Rd
- 2857 SW 142nd Ln
- 0 SW 143rd Place Rd Unit R10542426
- 0 143 Sw Place Rd
- 0 SW 143rd Place Rd Unit Lot 2 O6011523
- 2830 SW 143rd Place Rd
- 2830 SW 143 Place Rd
- 2863 SW 142nd Ln
- 2875 SW 140th Loop
- 2737 SW 143 Place Rd
- 0 SW 28th Ct Unit R10816835
Your Personal Tour Guide
Ask me questions while you tour the home.