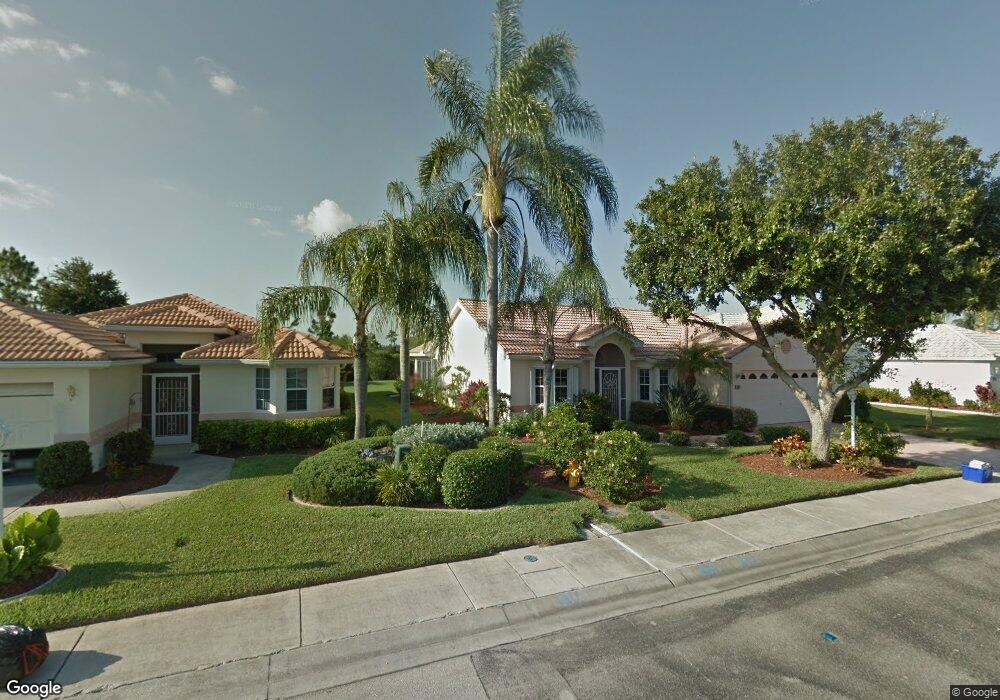
2811 Valparaiso Blvd North Fort Myers, FL 33917
Jacaranda NeighborhoodEstimated Value: $304,145 - $360,000
2
Beds
2
Baths
1,485
Sq Ft
$220/Sq Ft
Est. Value
About This Home
This home is located at 2811 Valparaiso Blvd, North Fort Myers, FL 33917 and is currently estimated at $326,286, approximately $219 per square foot. 2811 Valparaiso Blvd is a home located in Lee County with nearby schools including Dr. Carrie D. Robinson Littleton Elementary School, J. Colin English Elementary School, and Tropic Isles Elementary School.
Ownership History
Date
Name
Owned For
Owner Type
Purchase Details
Closed on
Jan 23, 2024
Sold by
Trammell Gregory James and Trammell Barbara Elaine
Bought by
Asschert Marcel H and Asschert Lori E
Current Estimated Value
Purchase Details
Closed on
Mar 24, 2022
Sold by
Chadwell Barry W and Chadwell Kandice S
Bought by
Trammell Gregory James and Trammell Barbara Elaine
Purchase Details
Closed on
May 14, 2015
Sold by
Mullenhoff Paul A
Bought by
Chadwell Barry W and Chadwell Kandice S
Home Financials for this Owner
Home Financials are based on the most recent Mortgage that was taken out on this home.
Original Mortgage
$143,587
Interest Rate
3.8%
Mortgage Type
VA
Purchase Details
Closed on
Aug 30, 1994
Sold by
Del Vera Ltd Ptnr
Bought by
Mullenhoff Paul A and Mullenhoff Mary E
Create a Home Valuation Report for This Property
The Home Valuation Report is an in-depth analysis detailing your home's value as well as a comparison with similar homes in the area
Home Values in the Area
Average Home Value in this Area
Purchase History
| Date | Buyer | Sale Price | Title Company |
|---|---|---|---|
| Asschert Marcel H | $347,500 | Title Professionals | |
| Trammell Gregory James | $355,000 | Jewel Stone Title | |
| Chadwell Barry W | $139,000 | Jewel Stone Title Insurance | |
| Mullenhoff Paul A | $114,200 | -- |
Source: Public Records
Mortgage History
| Date | Status | Borrower | Loan Amount |
|---|---|---|---|
| Previous Owner | Chadwell Barry W | $143,587 |
Source: Public Records
Tax History Compared to Growth
Tax History
| Year | Tax Paid | Tax Assessment Tax Assessment Total Assessment is a certain percentage of the fair market value that is determined by local assessors to be the total taxable value of land and additions on the property. | Land | Improvement |
|---|---|---|---|---|
| 2025 | $5,499 | $250,000 | $63,954 | $184,663 |
| 2024 | $5,541 | $259,305 | $108,407 | $149,626 |
| 2023 | $5,541 | $260,070 | $96,545 | $162,435 |
| 2022 | $3,417 | $141,520 | $0 | $0 |
| 2021 | $3,354 | $149,994 | $32,000 | $117,994 |
| 2020 | $3,356 | $135,501 | $0 | $0 |
| 2019 | $3,178 | $132,455 | $0 | $0 |
| 2018 | $3,168 | $129,985 | $0 | $0 |
| 2017 | $3,157 | $127,311 | $0 | $0 |
| 2016 | $2,961 | $121,811 | $30,000 | $91,811 |
| 2015 | $2,584 | $118,302 | $25,000 | $93,302 |
| 2014 | $2,570 | $112,397 | $25,000 | $87,397 |
| 2013 | -- | $94,893 | $25,600 | $69,293 |
Source: Public Records
Map
Nearby Homes
- 2680 Via Presidio
- 2580 Valparaiso Blvd
- 2461 Palo Duro Blvd
- 20698 Marathona Ct
- 2380 Palo Duro Blvd
- 20710 Mystic Way
- 2241 Rio Nuevo Dr
- 2320 Palo Duro Blvd
- 2270 Palo Duro Blvd
- 2271 Valparaiso Blvd
- 20716 Tisbury Ln
- 2170 Rio Nuevo Dr
- 2190 Corona Del Sire Dr Unit 1
- 2220 Valparaiso Blvd
- 2170 Faliron Rd
- 2160 Palo Duro Blvd
- 20768 Tisbury Ln
- 20927 Athenian Ln
- 2303 Bayberry Ln
- 2071 Rio Nuevo Dr
- 2751 Valparaiso Blvd
- 2761 Valparaiso Blvd Unit 12
- 2761 Valparaiso Blvd
- 2741 Valparaiso Blvd
- 2771 Valparaiso Blvd
- 2760 Valparaiso Blvd Unit 5
- 2770 Valparaiso Blvd
- 2750 Valparaiso Blvd
- 2731 Valparaiso Blvd
- 2781 Valparaiso Blvd
- 2780 Valparaiso Blvd
- 2740 Valparaiso Blvd
- 2791 Valparaiso Blvd
- 2721 Valparaiso Blvd
- 2790 Valparaiso Blvd
- 2720 Valparaiso Blvd
- 2801 Valparaiso Blvd
- 2781 Via la Quinta
- 2690 Valparaiso Blvd
- 2711 Valparaiso Blvd