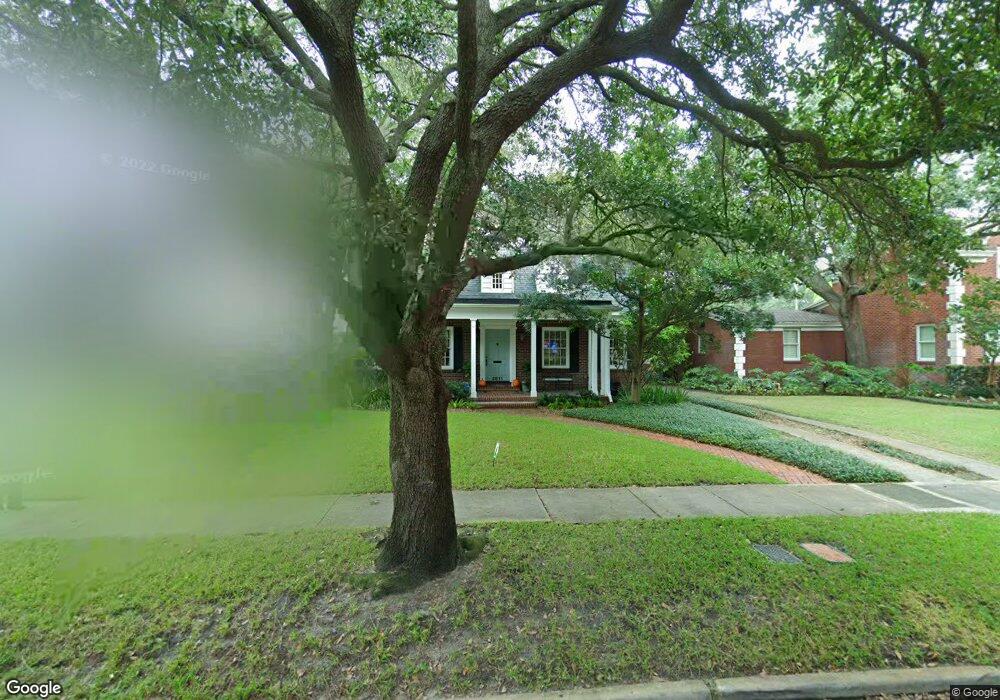
2811 W Parkland Blvd Tampa, FL 33609
Parkland Estates NeighborhoodEstimated Value: $1,547,000 - $1,901,000
4
Beds
1
Bath
3,274
Sq Ft
$522/Sq Ft
Est. Value
About This Home
This home is located at 2811 W Parkland Blvd, Tampa, FL 33609 and is currently estimated at $1,707,999, approximately $521 per square foot. 2811 W Parkland Blvd is a home located in Hillsborough County with nearby schools including Mitchell Elementary School, Wilson Middle School, and Plant High School.
Ownership History
Date
Name
Owned For
Owner Type
Purchase Details
Closed on
Jun 4, 2025
Sold by
Barbara B Romano Revocable Trust and Romano Barbara Barritt
Bought by
Brannan Samuel and Wozniak Briana
Current Estimated Value
Home Financials for this Owner
Home Financials are based on the most recent Mortgage that was taken out on this home.
Original Mortgage
$1,264,000
Outstanding Balance
$1,259,284
Interest Rate
6.38%
Mortgage Type
New Conventional
Estimated Equity
$448,715
Purchase Details
Closed on
Feb 20, 2006
Sold by
Harshman Sue S
Bought by
Romano Barbara B
Home Financials for this Owner
Home Financials are based on the most recent Mortgage that was taken out on this home.
Original Mortgage
$543,920
Interest Rate
6.08%
Mortgage Type
Unknown
Purchase Details
Closed on
Nov 2, 1994
Sold by
Eady Radolph and Eady Betty D
Bought by
Harshman Sue S
Home Financials for this Owner
Home Financials are based on the most recent Mortgage that was taken out on this home.
Original Mortgage
$150,000
Interest Rate
8.68%
Create a Home Valuation Report for This Property
The Home Valuation Report is an in-depth analysis detailing your home's value as well as a comparison with similar homes in the area
Home Values in the Area
Average Home Value in this Area
Purchase History
| Date | Buyer | Sale Price | Title Company |
|---|---|---|---|
| Brannan Samuel | $1,580,000 | La Maison Title | |
| Romano Barbara B | $679,900 | Bayshore Title Insurance Co | |
| Harshman Sue S | $265,000 | -- |
Source: Public Records
Mortgage History
| Date | Status | Borrower | Loan Amount |
|---|---|---|---|
| Open | Brannan Samuel | $1,264,000 | |
| Previous Owner | Romano Barbara B | $543,920 | |
| Previous Owner | Harshman Sue S | $150,000 |
Source: Public Records
Tax History Compared to Growth
Tax History
| Year | Tax Paid | Tax Assessment Tax Assessment Total Assessment is a certain percentage of the fair market value that is determined by local assessors to be the total taxable value of land and additions on the property. | Land | Improvement |
|---|---|---|---|---|
| 2024 | $21,039 | $1,239,729 | $475,104 | $764,625 |
| 2023 | $19,586 | $1,180,305 | $446,016 | $734,289 |
| 2022 | $17,007 | $901,366 | $446,016 | $455,350 |
| 2021 | $15,548 | $774,333 | $426,624 | $347,709 |
| 2020 | $16,276 | $806,223 | $426,624 | $379,599 |
| 2019 | $15,892 | $780,724 | $416,928 | $363,796 |
| 2018 | $15,201 | $754,850 | $0 | $0 |
| 2017 | $13,842 | $666,889 | $0 | $0 |
| 2016 | $12,939 | $627,256 | $0 | $0 |
| 2015 | $11,966 | $571,510 | $0 | $0 |
| 2014 | $10,959 | $521,945 | $0 | $0 |
| 2013 | -- | $488,581 | $0 | $0 |
Source: Public Records
Map
Nearby Homes
- 2807 W Parkland Blvd
- 2522 W Watrous Ave
- 3102 W Fountain Blvd
- 3107 W Watrous Ave
- 2630 W Sunset Dr
- 2402 W Parkland Blvd
- 3111 W De Leon St Unit 10
- 1011 S Moody Ave Unit 11
- 2900 W Azeele St Unit M
- 2900 W Azeele St Unit H
- 2442 W Prospect Rd
- 2808 W Azeele St Unit 117
- 3102 W Horatio St Unit 12
- 408 S Arrawana Ave Unit A3
- 407 S Audubon Ave Unit 4
- 2311 W Morrison Ave Unit 1
- 3202 W De Leon St Unit B
- 2704 W Azeele St
- 2402 Victoria Gardens Ln
- 3211 W Swann Ave Unit 806
- 2813 W Parkland Blvd
- 2815 W Parkland Blvd
- 2806 W Terrace Dr
- 2802 W Terrace Dr
- 2805 W Parkland Blvd
- 2808 W Terrace Dr
- 2817 W Parkland Blvd
- 2808 W Parkland Blvd
- 2810 W Parkland Blvd
- 2812 W Terrace Dr
- 2812 W Parkland Blvd
- 2812 W Parkland Blvd Unit 1/2
- 2903 W Parkland Blvd
- 2819 W Parkland Blvd
- 2722 W Terrace Dr
- 2814 W Parkland Blvd
- 2723 W Parkland Blvd
- 2816 W Terrace Dr
- 2805 W Terrace Dr