Estimated Value: $623,000 - $702,000
5
Beds
4
Baths
4,051
Sq Ft
$161/Sq Ft
Est. Value
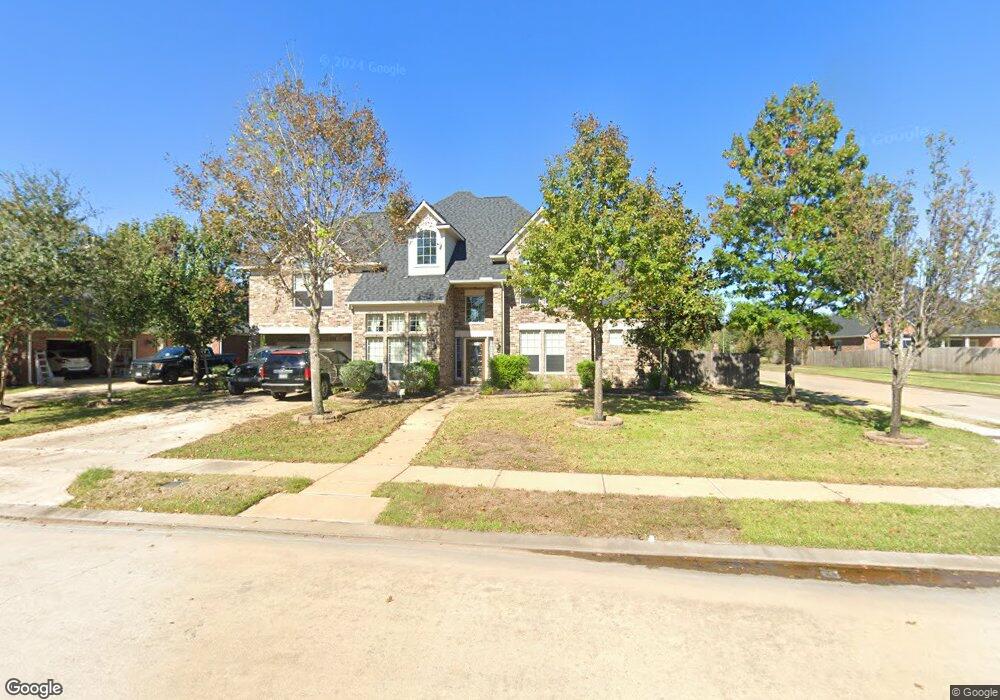
About This Home
This home is located at 28110 Gadwall Dr, Katy, TX 77494 and is currently estimated at $653,189, approximately $161 per square foot. 28110 Gadwall Dr is a home located in Fort Bend County with nearby schools including Ray And Jamie Wolman Elementary School, Woodcreek Junior High School, and Katy High School.
Ownership History
Date
Name
Owned For
Owner Type
Purchase Details
Closed on
Apr 28, 2009
Sold by
Federal Home Loan Mortgage Corporation
Bought by
Vopelius James Joseph and Vopelius Jessica Lynn
Current Estimated Value
Home Financials for this Owner
Home Financials are based on the most recent Mortgage that was taken out on this home.
Original Mortgage
$325,000
Outstanding Balance
$204,456
Interest Rate
4.77%
Mortgage Type
Purchase Money Mortgage
Estimated Equity
$448,733
Purchase Details
Closed on
Feb 3, 2009
Sold by
Marquez Christopher and Marquez Dorothy
Bought by
Jp Morgan Chase Bank Na
Purchase Details
Closed on
Nov 30, 2006
Sold by
Mhi Partnership Ltd
Bought by
Marquez Christopher and Marquez Dorothy
Home Financials for this Owner
Home Financials are based on the most recent Mortgage that was taken out on this home.
Original Mortgage
$326,817
Interest Rate
6.27%
Mortgage Type
Purchase Money Mortgage
Create a Home Valuation Report for This Property
The Home Valuation Report is an in-depth analysis detailing your home's value as well as a comparison with similar homes in the area
Home Values in the Area
Average Home Value in this Area
Purchase History
| Date | Buyer | Sale Price | Title Company |
|---|---|---|---|
| Vopelius James Joseph | -- | Multiple | |
| Jp Morgan Chase Bank Na | $363,413 | None Available | |
| Vopelius James Joseph | -- | -- | |
| Marquez Christopher | -- | Millennium Title Houston | |
| Vopelius James Joseph | -- | -- |
Source: Public Records
Mortgage History
| Date | Status | Borrower | Loan Amount |
|---|---|---|---|
| Open | Vopelius James Joseph | $325,000 | |
| Previous Owner | Vopelius James Joseph | $326,817 |
Source: Public Records
Tax History
| Year | Tax Paid | Tax Assessment Tax Assessment Total Assessment is a certain percentage of the fair market value that is determined by local assessors to be the total taxable value of land and additions on the property. | Land | Improvement |
|---|---|---|---|---|
| 2025 | $12,012 | $624,362 | $123,110 | $501,252 |
| 2024 | $12,012 | $587,516 | $17,786 | $569,730 |
| 2023 | $11,114 | $534,105 | $0 | $573,040 |
| 2022 | $11,693 | $485,550 | $0 | $525,360 |
| 2021 | $11,894 | $441,410 | $94,700 | $346,710 |
| 2020 | $11,661 | $426,820 | $73,500 | $353,320 |
| 2019 | $12,045 | $411,000 | $73,500 | $337,500 |
| 2018 | $12,567 | $425,180 | $73,500 | $351,680 |
| 2017 | $12,415 | $415,140 | $73,500 | $341,640 |
| 2016 | $12,814 | $428,460 | $73,500 | $354,960 |
| 2015 | $7,151 | $395,180 | $73,500 | $321,680 |
| 2014 | $6,677 | $359,250 | $73,500 | $285,750 |
Source: Public Records
Map
Nearby Homes
- 28130 Canyon Wren Dr
- 28219 Longspur Dr
- 2302 Osprey Park Dr
- 28011 Canyon Wren Dr
- 28006 Rusty Hawthorne Dr
- 28119 Rusty Hawthorne Dr
- 2519 Llano Springs Dr
- 27907 Warren Park Dr
- 27902 Eastonwood Ct
- 28203 Fantail Dr
- 2402 Chesley Park Ct
- 27703 Rumson Dr
- 27610 Hunting Bay Ct
- 2203 Draycutt Dr
- 28223 Daystrom Ln
- 2710 Carlson Manor Dr
- 27419 Gladway Manor Dr
- 28514 Blue Holly Ln
- 2802 Helding Park Ct
- 2506 Foxcrest Dr
- 28114 Gadwall Dr
- 28115 Longspur Dr
- 28106 Gadwall Dr
- 28119 Longspur Dr
- 28118 Gadwall Dr
- 28107 Longspur Dr
- 28111 Gadwall Dr
- 28123 Longspur Dr
- 28115 Gadwall Dr
- 28107 Gadwall Dr
- 28102 Gadwall Dr
- 28122 Gadwall Dr
- 28119 Gadwall Dr
- 28103 Longspur Dr
- 28127 Longspur Dr
- 2218 Castell Manor Dr
- 28026 Gadwall Dr
- 28123 Gadwall Dr
- 28023 Longspur Dr
- 28202 Gadwall Dr
Your Personal Tour Guide
Ask me questions while you tour the home.