S
Landlord's Agent in 2016
Scott Collins
RE/MAX Showcase

Estimated Value: $212,000 - $254,000
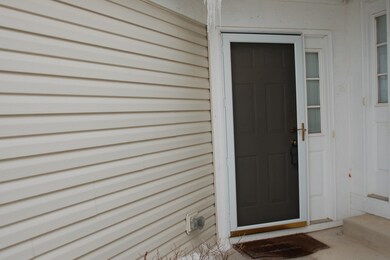
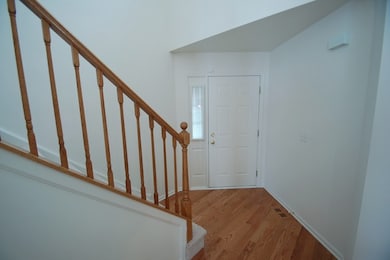
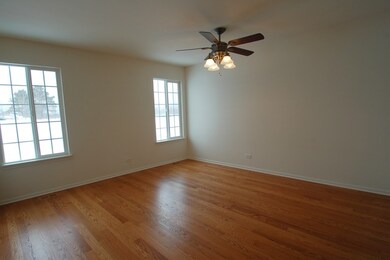
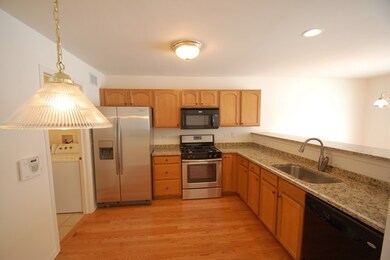
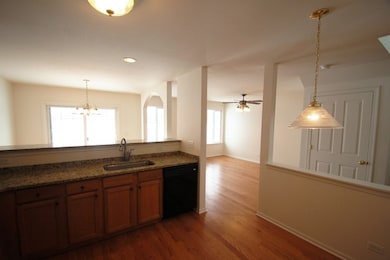
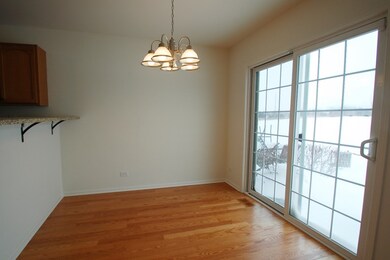
Beautifully remodeled townhouse on premium lot backs to vacant property. Home was remolded just two years ago. Solid wood oak flooring. Neutral paint colors. Neutral plush carpeting on 2nd floor. Stainless steel refrigerator and oven. Microwave and dishwasher included. Granite counter tops along with a breakfast bar in kitchen. Washer and dryer in unit too. Ceramic flooring in upstairs master and hall bathrooms. Full basement. 2 Car Garage!
Last Agent to Rent the Property
Scott Collins
RE/MAX Showcase Listed on: 02/15/2016
| Date | Buyer | Sale Price | Title Company |
|---|---|---|---|
| The Brian V Fry Trust | -- | None Available | |
| Fry Brian | $90,000 | American National Title Serv | |
| Bandemer Raymond R | $204,000 | First American Title Ins Co |
| Date | Status | Borrower | Loan Amount |
|---|---|---|---|
| Previous Owner | Bandemer Raymond R | $183,500 |
| Date | Event | Price | List to Sale | Price per Sq Ft | Prior Sale |
|---|---|---|---|---|---|
| 04/12/2016 04/12/16 | Rented | $1,500 | 0.0% | -- | |
| 04/11/2016 04/11/16 | Under Contract | -- | -- | -- | |
| 02/15/2016 02/15/16 | For Rent | $1,500 | 0.0% | -- | |
| 08/14/2013 08/14/13 | Sold | $90,000 | +0.1% | $69 / Sq Ft | View Prior Sale |
| 04/08/2013 04/08/13 | Pending | -- | -- | -- | |
| 04/03/2013 04/03/13 | Price Changed | $89,900 | -3.2% | $69 / Sq Ft | |
| 02/20/2013 02/20/13 | For Sale | $92,900 | 0.0% | $71 / Sq Ft | |
| 02/15/2013 02/15/13 | Pending | -- | -- | -- | |
| 02/05/2013 02/05/13 | For Sale | $92,900 | 0.0% | $71 / Sq Ft | |
| 11/27/2012 11/27/12 | Pending | -- | -- | -- | |
| 11/27/2012 11/27/12 | For Sale | $92,900 | -- | $71 / Sq Ft |
| Year | Tax Paid | Tax Assessment Tax Assessment Total Assessment is a certain percentage of the fair market value that is determined by local assessors to be the total taxable value of land and additions on the property. | Land | Improvement |
|---|---|---|---|---|
| 2024 | $5,617 | $72,080 | $8,306 | $63,774 |
| 2023 | $5,509 | $59,488 | $7,825 | $51,663 |
| 2022 | $5,509 | $57,729 | $5,576 | $52,153 |
| 2021 | $5,317 | $54,415 | $5,256 | $49,159 |
| 2020 | $5,384 | $54,099 | $5,181 | $48,918 |
| 2019 | $5,279 | $51,878 | $4,968 | $46,910 |
| 2018 | $3,914 | $36,672 | $5,567 | $31,105 |
| 2017 | $3,811 | $33,896 | $5,146 | $28,750 |
| 2016 | $3,823 | $31,000 | $4,706 | $26,294 |
| 2015 | $3,742 | $28,929 | $4,392 | $24,537 |
| 2014 | $2,967 | $26,059 | $4,193 | $21,866 |
| 2012 | $4,156 | $30,956 | $4,370 | $26,586 |
S
Landlord's Agent in 2016
Scott Collins
RE/MAX Showcase

Tenant's Agent in 2016
John Trandel
Baird Warner
(847) 650-1552
81 Total Sales
Seller's Agent in 2013
Vic Singh
Pathfinder Realty LLC
(847) 508-5184
55 Total Sales
Source: Midwest Real Estate Data (MRED)
MLS Number: MRD09139848
APN: 05-33-202-009
Disclaimer: Certain information contained herein is derived from information provided by parties other than Homes.com. All information provided is deemed reliable, but is not guaranteed to be accurate and should be independently verified.
![]() Based on information submitted to the MLS GRID. All data is obtained from various sources and may not have been verified by broker or MLS GRID. Supplied Open House Information is subject to change without notice. All information should be independently reviewed and verified for accuracy. Properties may or may not be listed by the office/agent presenting the information. Some IDX listings have been excluded from this website.
Based on information submitted to the MLS GRID. All data is obtained from various sources and may not have been verified by broker or MLS GRID. Supplied Open House Information is subject to change without notice. All information should be independently reviewed and verified for accuracy. Properties may or may not be listed by the office/agent presenting the information. Some IDX listings have been excluded from this website.
The Digital Millennium Copyright Act of 1998, 17 U.S.C. § 512 (the “DMCA”) provides recourse for copyright owners who believe that material appearing on the Internet infringes their rights under U.S. copyright law. If you believe in good faith that any content or material made available in connection with our website or services infringes your copyright, you (or your agent) may send us a notice requesting that the content or material be removed, or access to it blocked.
Notices must be sent in writing by email to DMCAnotice@MLSGrid.com.
The DMCA requires that your notice of alleged copyright infringement include the following information:
(1) description of the copyrighted work that is the subject of claimed infringement;
(2) description of the alleged infringing content and information sufficient to permit us to locate the content;
(3) contact information for you, including your address, telephone number and email address;
(4) a statement by you that you have a good faith belief that the content in the manner complained of is not authorized by the copyright owner, or its agent, or by the operation of any law;
(5) a statement by you, signed under penalty of perjury, that the information in the notification is accurate and that you have the authority to enforce the copyrights that are claimed to be infringed; and
(6) a physical or electronic signature of the copyright owner or a person authorized to act on the copyright owner’s behalf. Failure to include all of the above information may result in the delay of the processing of your complaint.