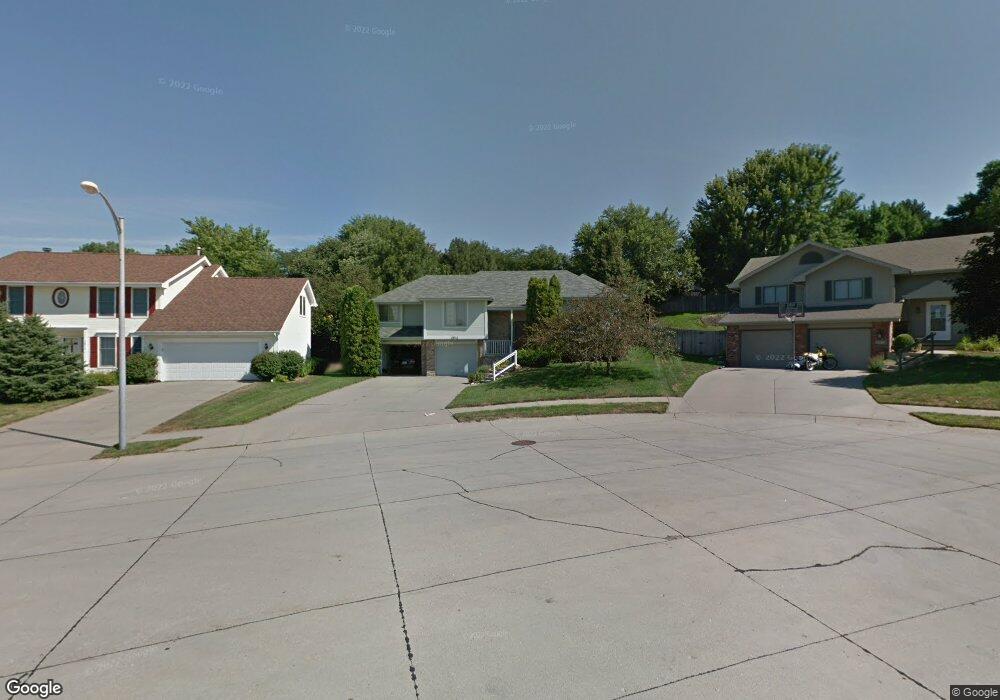
2812 Courtney Cir Bellevue, NE 68123
Estimated Value: $338,340 - $361,000
3
Beds
5
Baths
2,395
Sq Ft
$146/Sq Ft
Est. Value
About This Home
This home is located at 2812 Courtney Cir, Bellevue, NE 68123 and is currently estimated at $350,335, approximately $146 per square foot. 2812 Courtney Cir is a home located in Sarpy County with nearby schools including Leonard Lawrence Elementary School, Lewis & Clark Middle School, and Bellevue West High School.
Ownership History
Date
Name
Owned For
Owner Type
Purchase Details
Closed on
Sep 20, 2014
Sold by
Larson Andrew James and Larson Jessica J
Bought by
Larson Andrew James and Larson Jessica J
Current Estimated Value
Home Financials for this Owner
Home Financials are based on the most recent Mortgage that was taken out on this home.
Original Mortgage
$115,876
Outstanding Balance
$38,143
Interest Rate
4.1%
Estimated Equity
$312,192
Purchase Details
Closed on
Apr 9, 2003
Sold by
Poock Christopher J and Poock Thelma L
Bought by
Larson Andrew James
Home Financials for this Owner
Home Financials are based on the most recent Mortgage that was taken out on this home.
Original Mortgage
$172,350
Interest Rate
5.87%
Purchase Details
Closed on
Jun 15, 1998
Sold by
Roy Mcpherson Michael and Roy Darlene A
Bought by
Poock Christopher J and Poock Thelma L
Home Financials for this Owner
Home Financials are based on the most recent Mortgage that was taken out on this home.
Original Mortgage
$154,500
Interest Rate
7.21%
Create a Home Valuation Report for This Property
The Home Valuation Report is an in-depth analysis detailing your home's value as well as a comparison with similar homes in the area
Home Values in the Area
Average Home Value in this Area
Purchase History
| Date | Buyer | Sale Price | Title Company |
|---|---|---|---|
| Larson Andrew James | -- | En Title Insurance Company | |
| Larson Andrew James | $169,000 | -- | |
| Poock Christopher J | $150,000 | -- |
Source: Public Records
Mortgage History
| Date | Status | Borrower | Loan Amount |
|---|---|---|---|
| Open | Larson Andrew James | $115,876 | |
| Closed | Larson Andrew James | $172,350 | |
| Previous Owner | Poock Christopher J | $154,500 |
Source: Public Records
Tax History Compared to Growth
Tax History
| Year | Tax Paid | Tax Assessment Tax Assessment Total Assessment is a certain percentage of the fair market value that is determined by local assessors to be the total taxable value of land and additions on the property. | Land | Improvement |
|---|---|---|---|---|
| 2025 | $5,693 | $316,932 | $55,000 | $261,932 |
| 2024 | $2,616 | $300,732 | $50,000 | $250,732 |
| 2023 | $2,616 | $123,888 | $44,000 | $79,888 |
| 2022 | $5,169 | $240,200 | $44,000 | $196,200 |
| 2021 | $4,750 | $218,380 | $44,000 | $174,380 |
| 2020 | $4,592 | $210,419 | $38,000 | $172,419 |
| 2019 | $4,495 | $207,274 | $38,000 | $169,274 |
| 2018 | $4,658 | $200,988 | $36,000 | $164,988 |
| 2017 | $4,383 | $186,813 | $36,000 | $150,813 |
| 2016 | $4,298 | $186,768 | $32,000 | $154,768 |
| 2015 | $4,178 | $185,130 | $30,000 | $155,130 |
| 2014 | $4,193 | $186,400 | $30,000 | $156,400 |
| 2012 | -- | $175,129 | $30,000 | $145,129 |
Source: Public Records
Map
Nearby Homes
- 13403 S 28th St
- 13211 S 26th Ave
- 2512 Nottingham Dr
- 2923 Blackhawk Dr
- 3105 Mirror Cir
- 12901 S 29th Place
- 2939 Lone Tree Rd
- 12722 S 28th Ave
- 2940 Leawood Dr
- 3102 Redwing Dr
- 3309 Lookingglass Dr
- 3105 Leawood Dr
- 3504 Sheridan Cir
- 3506 Lynnwood Dr
- 3508 Jason Cir
- 14002 Tregaron Ridge Ave Unit B
- 3113 Tammy St
- 13602 S 36th St
- 12915 Forestdale Dr
- 3716 Lookingglass Dr
- 2814 Courtney Cir
- 2810 Courtney Cir
- 0 Courtney Cir
- 2816 Courtney Cir
- 2815 Nottingham Dr
- 2811 Nottingham Dr
- 2809 Courtney Cir
- 2817 Nottingham Dr
- 2813 Courtney Cir
- 2809 Nottingham Dr
- 2811 Courtney Cir
- 13306 S 28th St
- 13308 S 28th St
- 13310 S 28th St
- 13312 S 28th St
- 2807 Nottingham Dr
- 2903 Courtney Dr
- 13402 S 28th St
- 2902 Schuemann Dr
- 13407 S 29th St