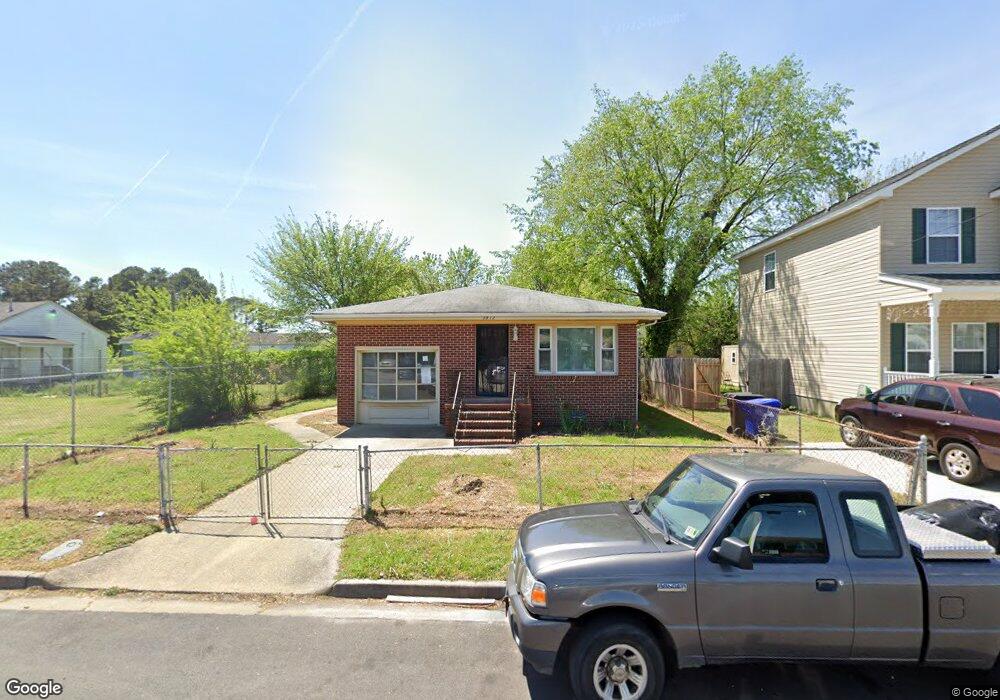
2812 Evergreen Place Portsmouth, VA 23704
South Portsmouth NeighborhoodEstimated Value: $234,000 - $262,000
3
Beds
2
Baths
1,479
Sq Ft
$171/Sq Ft
Est. Value
About This Home
This home is located at 2812 Evergreen Place, Portsmouth, VA 23704 and is currently estimated at $252,571, approximately $170 per square foot. 2812 Evergreen Place is a home located in Portsmouth City with nearby schools including Douglass Park Elementary School, Manor High School, and St Mark Christian Academy.
Ownership History
Date
Name
Owned For
Owner Type
Purchase Details
Closed on
May 14, 2024
Sold by
Ni Yanna
Bought by
Carrier Jasmine C
Current Estimated Value
Home Financials for this Owner
Home Financials are based on the most recent Mortgage that was taken out on this home.
Original Mortgage
$239,481
Outstanding Balance
$235,903
Interest Rate
6.88%
Mortgage Type
FHA
Estimated Equity
$16,668
Purchase Details
Closed on
Feb 5, 2019
Sold by
Sun West Mortgage Company Inc
Bought by
The Secretary Of Hud
Purchase Details
Closed on
Apr 6, 2018
Sold by
Alg Trustee Llc A Virginia Limited Liabi and Davis Mark C
Bought by
Sun West Mortgage Company Inc
Purchase Details
Closed on
Oct 18, 2006
Sold by
Parker James H
Bought by
Davis Mark C
Home Financials for this Owner
Home Financials are based on the most recent Mortgage that was taken out on this home.
Original Mortgage
$130,000
Interest Rate
6.48%
Mortgage Type
New Conventional
Create a Home Valuation Report for This Property
The Home Valuation Report is an in-depth analysis detailing your home's value as well as a comparison with similar homes in the area
Home Values in the Area
Average Home Value in this Area
Purchase History
| Date | Buyer | Sale Price | Title Company |
|---|---|---|---|
| Carrier Jasmine C | $243,900 | Fidelity National Title | |
| The Secretary Of Hud | $66,740 | Attorney | |
| Sun West Mortgage Company Inc | $66,740 | None Available | |
| Davis Mark C | $130,000 | -- |
Source: Public Records
Mortgage History
| Date | Status | Borrower | Loan Amount |
|---|---|---|---|
| Open | Carrier Jasmine C | $239,481 | |
| Previous Owner | Davis Mark C | $130,000 |
Source: Public Records
Tax History Compared to Growth
Tax History
| Year | Tax Paid | Tax Assessment Tax Assessment Total Assessment is a certain percentage of the fair market value that is determined by local assessors to be the total taxable value of land and additions on the property. | Land | Improvement |
|---|---|---|---|---|
| 2025 | $2,968 | $229,930 | $54,690 | $175,240 |
| 2024 | $2,968 | $227,420 | $54,690 | $172,730 |
| 2023 | $2,712 | $203,300 | $54,690 | $148,610 |
| 2022 | $2,064 | $158,800 | $43,750 | $115,050 |
| 2021 | $1,972 | $151,660 | $36,610 | $115,050 |
| 2020 | $1,887 | $145,130 | $34,870 | $110,260 |
| 2019 | $1,855 | $142,730 | $34,870 | $107,860 |
| 2018 | $1,855 | $142,730 | $34,870 | $107,860 |
| 2017 | $1,778 | $136,740 | $34,870 | $101,870 |
| 2016 | $1,778 | $136,740 | $34,870 | $101,870 |
| 2015 | $1,778 | $136,740 | $34,870 | $101,870 |
| 2014 | $1,737 | $136,740 | $34,870 | $101,870 |
Source: Public Records
Map
Nearby Homes
- 2623 Columbus Ave
- 2629 Roanoke Ave
- 2537 Staunton Ave
- 2600 Roanoke Ave
- 2605 Roanoke Ave
- 1611 Highland Ave
- 1538 Centre Ave
- 1536 Centre Ave
- 2108 Evergreen Place
- 10 Dewey St
- 2314 Charleston Ave
- 2014 Piedmont Ave
- 2009 Deep Creek Blvd
- 1415 Summit Ave
- 2005 Piedmont Ave
- 1907 Azalea Ave
- 3324 Deep Creek Blvd
- 2002 Lansing Ave
- 2207 Richmond Ave
- 1805 Roanoke Ave
- 2808 Evergreen Place
- 1904 Portsmouth Blvd
- 1912 Portsmouth Blvd
- 2804 Evergreen Place
- 1900 Portsmouth Blvd
- 2803 Nashville Ave
- 2801 Nashville Ave
- 1918 Portsmouth Blvd
- 2807 Evergreen Place
- 2712 Evergreen Place
- 2805 Evergreen Place
- 2803 Evergreen Place
- 2719 Nashville Ave
- 2801 Evergreen Place
- 1822 Portsmouth Blvd
- 2713 Evergreen Place
- 2704 Evergreen Place
- 2717 Nashville Ave
- 2000 Portsmouth Blvd
- 2711 Evergreen Place