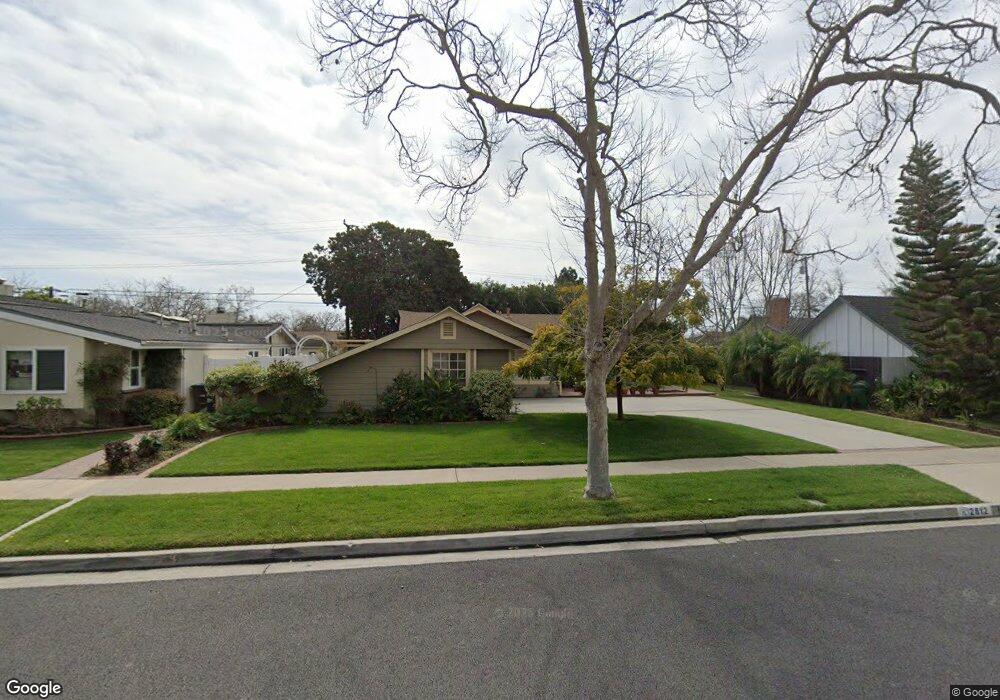
2812 Kempton Dr Los Alamitos, CA 90720
Rossmoor NeighborhoodEstimated Value: $1,388,057 - $1,692,000
3
Beds
2
Baths
1,639
Sq Ft
$915/Sq Ft
Est. Value
About This Home
This home is located at 2812 Kempton Dr, Los Alamitos, CA 90720 and is currently estimated at $1,499,014, approximately $914 per square foot. 2812 Kempton Dr is a home located in Orange County with nearby schools including Jack L. Weaver Elementary School, Francis Hopkinson Elementary School, and Oak Middle School.
Ownership History
Date
Name
Owned For
Owner Type
Purchase Details
Closed on
Jul 6, 2021
Sold by
Boland John M and Boland Rose Anne
Bought by
Boland John M and Boland Rose Anne
Current Estimated Value
Home Financials for this Owner
Home Financials are based on the most recent Mortgage that was taken out on this home.
Original Mortgage
$141,000
Interest Rate
2.93%
Mortgage Type
New Conventional
Purchase Details
Closed on
Nov 7, 2002
Sold by
Boland John M and Boland Roseanne M
Bought by
Boland John M and Boland Rose Anne M
Home Financials for this Owner
Home Financials are based on the most recent Mortgage that was taken out on this home.
Original Mortgage
$113,000
Interest Rate
5.95%
Purchase Details
Closed on
Nov 5, 2002
Sold by
Boland John M and Boland Roseanne M
Bought by
Boland John M and Boland Roseanne M
Home Financials for this Owner
Home Financials are based on the most recent Mortgage that was taken out on this home.
Original Mortgage
$113,000
Interest Rate
5.95%
Purchase Details
Closed on
Mar 26, 1998
Sold by
Boland John M and Boland Anne M
Bought by
Boland John M and Boland Roseanne M
Create a Home Valuation Report for This Property
The Home Valuation Report is an in-depth analysis detailing your home's value as well as a comparison with similar homes in the area
Home Values in the Area
Average Home Value in this Area
Purchase History
| Date | Buyer | Sale Price | Title Company |
|---|---|---|---|
| Boland John M | -- | Lawyers Title Company | |
| Boland John M | -- | Southland Title Corporation | |
| Boland John M | -- | -- | |
| Boland John M | -- | -- |
Source: Public Records
Mortgage History
| Date | Status | Borrower | Loan Amount |
|---|---|---|---|
| Closed | Boland John M | $141,000 | |
| Closed | Boland John M | $113,000 |
Source: Public Records
Tax History
| Year | Tax Paid | Tax Assessment Tax Assessment Total Assessment is a certain percentage of the fair market value that is determined by local assessors to be the total taxable value of land and additions on the property. | Land | Improvement |
|---|---|---|---|---|
| 2025 | $1,398 | $97,991 | $36,779 | $61,212 |
| 2024 | $1,398 | $96,070 | $36,058 | $60,012 |
| 2023 | $1,362 | $94,187 | $35,351 | $58,836 |
| 2022 | $1,348 | $92,341 | $34,658 | $57,683 |
| 2021 | $1,322 | $90,531 | $33,979 | $56,552 |
| 2020 | $1,322 | $89,603 | $33,630 | $55,973 |
| 2019 | $1,351 | $87,847 | $32,971 | $54,876 |
| 2018 | $1,318 | $86,125 | $32,325 | $53,800 |
| 2017 | $1,294 | $84,437 | $31,691 | $52,746 |
| 2016 | $1,273 | $82,782 | $31,070 | $51,712 |
| 2015 | $1,282 | $81,539 | $30,603 | $50,936 |
| 2014 | $1,245 | $79,942 | $30,003 | $49,939 |
Source: Public Records
Map
Nearby Homes
- 2671 Saint Albans Dr
- 12442 Christy Ln
- 3001 Saint Albans Dr
- 3141 Tucker Ln
- 3001 Inverness Dr
- 3181 Blume Dr
- 3092 Copa de Oro Dr
- 2692 Salmon Dr
- 3182 Brimhall Dr
- 12200 Montecito Rd Unit D221
- 12200 Montecito Rd Unit B315
- 12200 Montecito Rd Unit D303
- 12200 Montecito Rd Unit D312
- 12200 Montecito Rd Unit D101
- 12200 Montecito Rd Unit D301
- 12100 Montecito Rd
- 12021 Old Mill Rd
- 6976 E El Cedral St
- 3342 Bradbury Rd Unit 20
- 173 College Park Dr
- 2792 Kempton Dr
- 2822 Kempton Dr
- 2811 Mainway Dr
- 2782 Kempton Dr
- 2791 Mainway Dr
- 2821 Mainway Dr
- 12201 Foster Rd
- 2801 Kempton Dr
- 2781 Mainway Dr
- 2791 Kempton Dr
- 2852 Kempton Dr
- 2762 Kempton Dr
- 12181 Foster Rd
- 2781 Kempton Dr
- 2841 Mainway Dr
- 2761 Mainway Dr
- 12202 Foster Rd
- 2862 Kempton Dr
- 2792 Woodstock Rd
- 2752 Kempton Dr
Your Personal Tour Guide
Ask me questions while you tour the home.