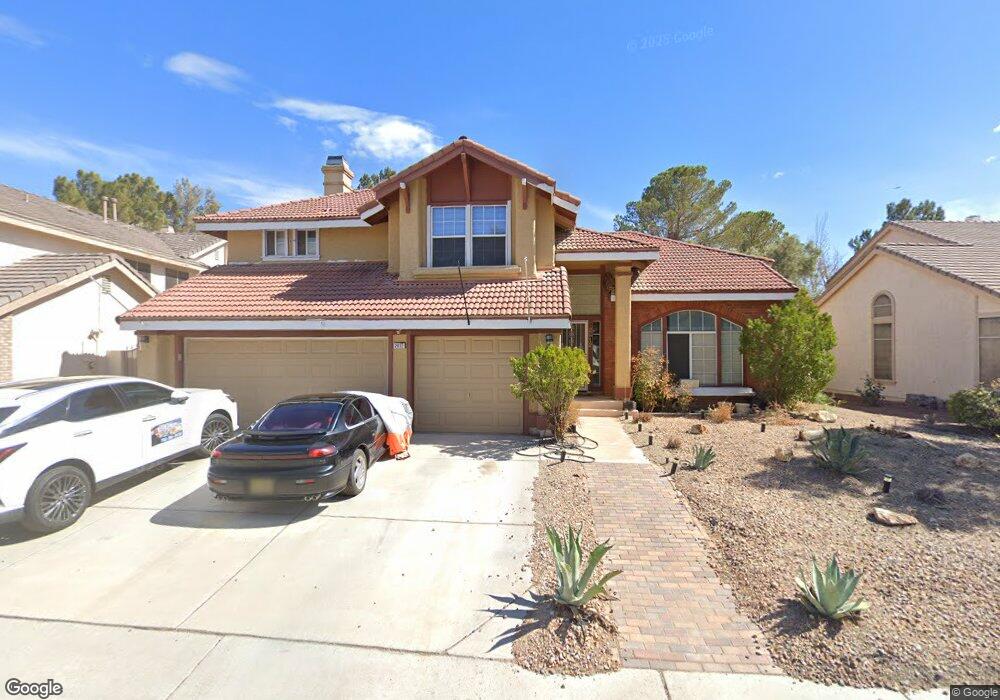
2812 Mellow Breeze St Las Vegas, NV 89117
The Section Seven NeighborhoodEstimated Value: $585,599 - $689,000
3
Beds
3
Baths
2,466
Sq Ft
$258/Sq Ft
Est. Value
About This Home
This home is located at 2812 Mellow Breeze St, Las Vegas, NV 89117 and is currently estimated at $637,400, approximately $258 per square foot. 2812 Mellow Breeze St is a home located in Clark County with nearby schools including M J Christensen Elementary School, Clifford J Lawrence Junior High School, and Bonanza High School.
Ownership History
Date
Name
Owned For
Owner Type
Purchase Details
Closed on
Jun 11, 1999
Sold by
Clay Jon J and Adair Audrey A
Bought by
Lear George and Lear Tesa
Current Estimated Value
Home Financials for this Owner
Home Financials are based on the most recent Mortgage that was taken out on this home.
Original Mortgage
$182,000
Interest Rate
7.11%
Purchase Details
Closed on
Nov 18, 1998
Sold by
Troxier & Associates Inc
Bought by
Clay Jon J and Adair Audrey A
Home Financials for this Owner
Home Financials are based on the most recent Mortgage that was taken out on this home.
Original Mortgage
$175,750
Interest Rate
6.69%
Purchase Details
Closed on
Mar 20, 1996
Sold by
Burk Evans S and Burk Virginia L
Bought by
Troxler & Associates Inc
Create a Home Valuation Report for This Property
The Home Valuation Report is an in-depth analysis detailing your home's value as well as a comparison with similar homes in the area
Home Values in the Area
Average Home Value in this Area
Purchase History
| Date | Buyer | Sale Price | Title Company |
|---|---|---|---|
| Lear George | -- | United Title | |
| Clay Jon J | $185,000 | First American Title Co | |
| Troxler & Associates Inc | -- | Fidelity National Title |
Source: Public Records
Mortgage History
| Date | Status | Borrower | Loan Amount |
|---|---|---|---|
| Previous Owner | Lear George | $182,000 | |
| Previous Owner | Clay Jon J | $175,750 |
Source: Public Records
Tax History Compared to Growth
Tax History
| Year | Tax Paid | Tax Assessment Tax Assessment Total Assessment is a certain percentage of the fair market value that is determined by local assessors to be the total taxable value of land and additions on the property. | Land | Improvement |
|---|---|---|---|---|
| 2025 | $2,765 | $117,507 | $52,150 | $65,357 |
| 2024 | $2,685 | $117,507 | $52,150 | $65,357 |
| 2023 | $2,685 | $109,847 | $46,900 | $62,947 |
| 2022 | $2,607 | $97,620 | $39,550 | $58,070 |
| 2021 | $2,531 | $93,182 | $37,450 | $55,732 |
| 2020 | $2,455 | $89,623 | $33,950 | $55,673 |
| 2019 | $2,383 | $85,162 | $30,100 | $55,062 |
| 2018 | $2,314 | $81,310 | $28,000 | $53,310 |
| 2017 | $2,703 | $82,433 | $28,000 | $54,433 |
| 2016 | $2,191 | $75,587 | $20,650 | $54,937 |
| 2015 | $2,186 | $64,703 | $17,850 | $46,853 |
| 2014 | $2,123 | $65,325 | $12,250 | $53,075 |
Source: Public Records
Map
Nearby Homes
- 9708 Blazing Star Ct
- 2728 Monrovia Dr
- 2724 Monrovia Dr
- 9724 Cascade Falls Ave
- 9544 Lazy River Dr
- 9713 Cascade Falls Ave
- 3001 Bridge Creek St
- 2821 Willow Wind Ct
- 2701 Purtell Cir
- 9605 Blowing Sand Cir
- 9717 Sierra Mesa Ave
- 9429 Abalone Way
- 9624 Beach Water Cir
- 9548 Wooden Pier Way
- 2909 Ivory Reef Ct
- 2300 Storkspur Way
- 9504 Cliff View Way
- 3009 Periscope Ct
- 2704 Messina Ct
- 2913 Domino Way
- 2816 Mellow Breeze St
- 2808 Mellow Breeze St
- 2900 Mellow Breeze St
- 2804 Mellow Breeze St
- 9709 Falling Star Ave
- 2904 Mellow Breeze St
- 9612 Runaway Ct
- 9713 Falling Star Ave
- 2800 Mellow Breeze St
- 9712 Blazing Star Ct
- 9709 Blazing Star Ct
- 2908 Mellow Breeze St
- 9609 Coral Way
- 9613 Runaway Ct
- 9717 Falling Star Ave
- 9612 Coral Way
- 9704 Falling Star Ave
- 9716 Blazing Star Ct
- 9713 Blazing Star Ct
- 9708 Falling Star Ave