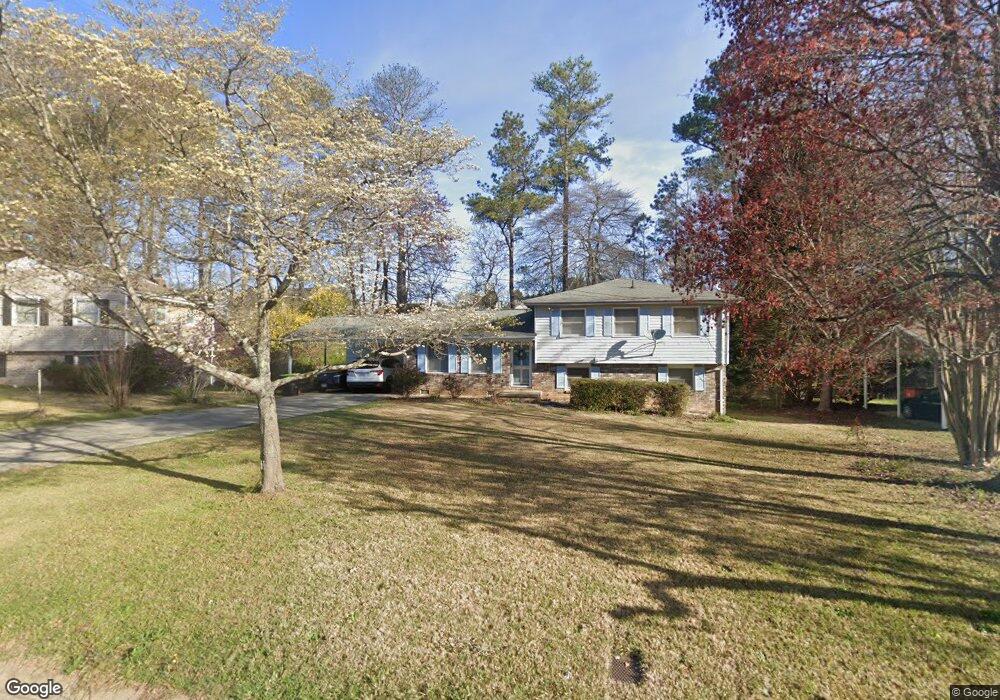
2812 Randy Ct Ellenwood, GA 30294
Estimated Value: $183,000 - $233,000
3
Beds
2
Baths
1,851
Sq Ft
$112/Sq Ft
Est. Value
About This Home
This home is located at 2812 Randy Ct, Ellenwood, GA 30294 and is currently estimated at $207,639, approximately $112 per square foot. 2812 Randy Ct is a home located in Clayton County with nearby schools including Thurgood Marshall Elementary School, Adamson Middle School, and Morrow High School.
Ownership History
Date
Name
Owned For
Owner Type
Purchase Details
Closed on
Mar 7, 2024
Sold by
Pham Hung
Bought by
Pham Hung Viet and Vo Nhi Thi
Current Estimated Value
Home Financials for this Owner
Home Financials are based on the most recent Mortgage that was taken out on this home.
Original Mortgage
$161,000
Outstanding Balance
$158,327
Interest Rate
6.64%
Mortgage Type
New Conventional
Estimated Equity
$49,312
Purchase Details
Closed on
Apr 24, 2017
Sold by
Nguyen Triec T
Bought by
Pham Hung and Vo Nhi
Home Financials for this Owner
Home Financials are based on the most recent Mortgage that was taken out on this home.
Original Mortgage
$64,000
Interest Rate
4.23%
Mortgage Type
New Conventional
Purchase Details
Closed on
Apr 8, 2015
Sold by
Nguyen Cong T
Bought by
Nguyen Triec T
Purchase Details
Closed on
May 26, 1998
Sold by
Wiggins Johnnie T and Wiggins Connie H
Bought by
Nguyen Cong T and Nguyen Triec T
Home Financials for this Owner
Home Financials are based on the most recent Mortgage that was taken out on this home.
Original Mortgage
$61,100
Interest Rate
7.11%
Mortgage Type
New Conventional
Create a Home Valuation Report for This Property
The Home Valuation Report is an in-depth analysis detailing your home's value as well as a comparison with similar homes in the area
Home Values in the Area
Average Home Value in this Area
Purchase History
| Date | Buyer | Sale Price | Title Company |
|---|---|---|---|
| Pham Hung Viet | -- | -- | |
| Pham Hung | $80,000 | -- | |
| Nguyen Triec T | $60,000 | -- | |
| Nguyen Cong T | $81,500 | -- |
Source: Public Records
Mortgage History
| Date | Status | Borrower | Loan Amount |
|---|---|---|---|
| Open | Pham Hung Viet | $161,000 | |
| Previous Owner | Pham Hung | $64,000 | |
| Previous Owner | Nguyen Cong T | $61,100 |
Source: Public Records
Tax History Compared to Growth
Tax History
| Year | Tax Paid | Tax Assessment Tax Assessment Total Assessment is a certain percentage of the fair market value that is determined by local assessors to be the total taxable value of land and additions on the property. | Land | Improvement |
|---|---|---|---|---|
| 2024 | $2,473 | $73,400 | $8,000 | $65,400 |
| 2023 | $2,566 | $71,080 | $8,000 | $63,080 |
| 2022 | $1,976 | $60,360 | $8,000 | $52,360 |
| 2021 | $1,498 | $47,920 | $8,000 | $39,920 |
| 2020 | $1,193 | $39,833 | $8,000 | $31,833 |
| 2019 | $913 | $32,492 | $6,400 | $26,092 |
| 2018 | $855 | $31,052 | $6,400 | $24,652 |
| 2017 | $332 | $25,390 | $6,400 | $18,990 |
| 2016 | $362 | $26,740 | $6,400 | $20,340 |
| 2015 | $212 | $0 | $0 | $0 |
| 2014 | $182 | $19,170 | $6,400 | $12,770 |
Source: Public Records
Map
Nearby Homes
- 2811 Appaloosa Run
- 2820 Rex Rd
- 6020 Cristie Dr
- 5838 Highway 42
- 6050 Randy Ln
- 2850 Amerson Trail
- 6082 Kathie Ct
- 5705 Laney Dr
- 5753 Gum Ct
- 2757 Shelley Ln
- 5631 Laney Dr
- 2635 Luke Dr
- 2278 Santa fe St Unit 18
- 2280 Santa fe St Unit 17
- 2306 Santa fe St Unit 9
- 5871 Dan Dr
- 0 Old Rex Morrow Rd Unit 7659496
- 0 Old Rex Morrow Rd Unit 10616003
- 6188 Cinnamon Ct
- 5790 Twain Dr
- 2820 Randy Ct Unit 4
- 2804 Randy Ct
- 0 Randy Ct Unit 7378989
- 0 Randy Ct Unit 7158350
- 0 Randy Ct Unit 8288287
- 0 Randy Ct Unit 8177162
- 0 Randy Ct
- 2832 Randy Ct
- 2819 Appaloosa Run
- 2813 Randy Ct
- 2819 Appaloosa Run
- 2798 Randy Ct
- 2803 Appaloosa Run
- 2828 Randy Ct Unit 4
- 2827 Appaloosa Run
- 2827 Appaloosa Run Unit 1
- 2795 Appaloosa Run Unit 1
- 2791 Randy Ct
- 2825 Randy Ct Unit 4
- 2835 Appaloosa Run Unit 1